Fig. 4.
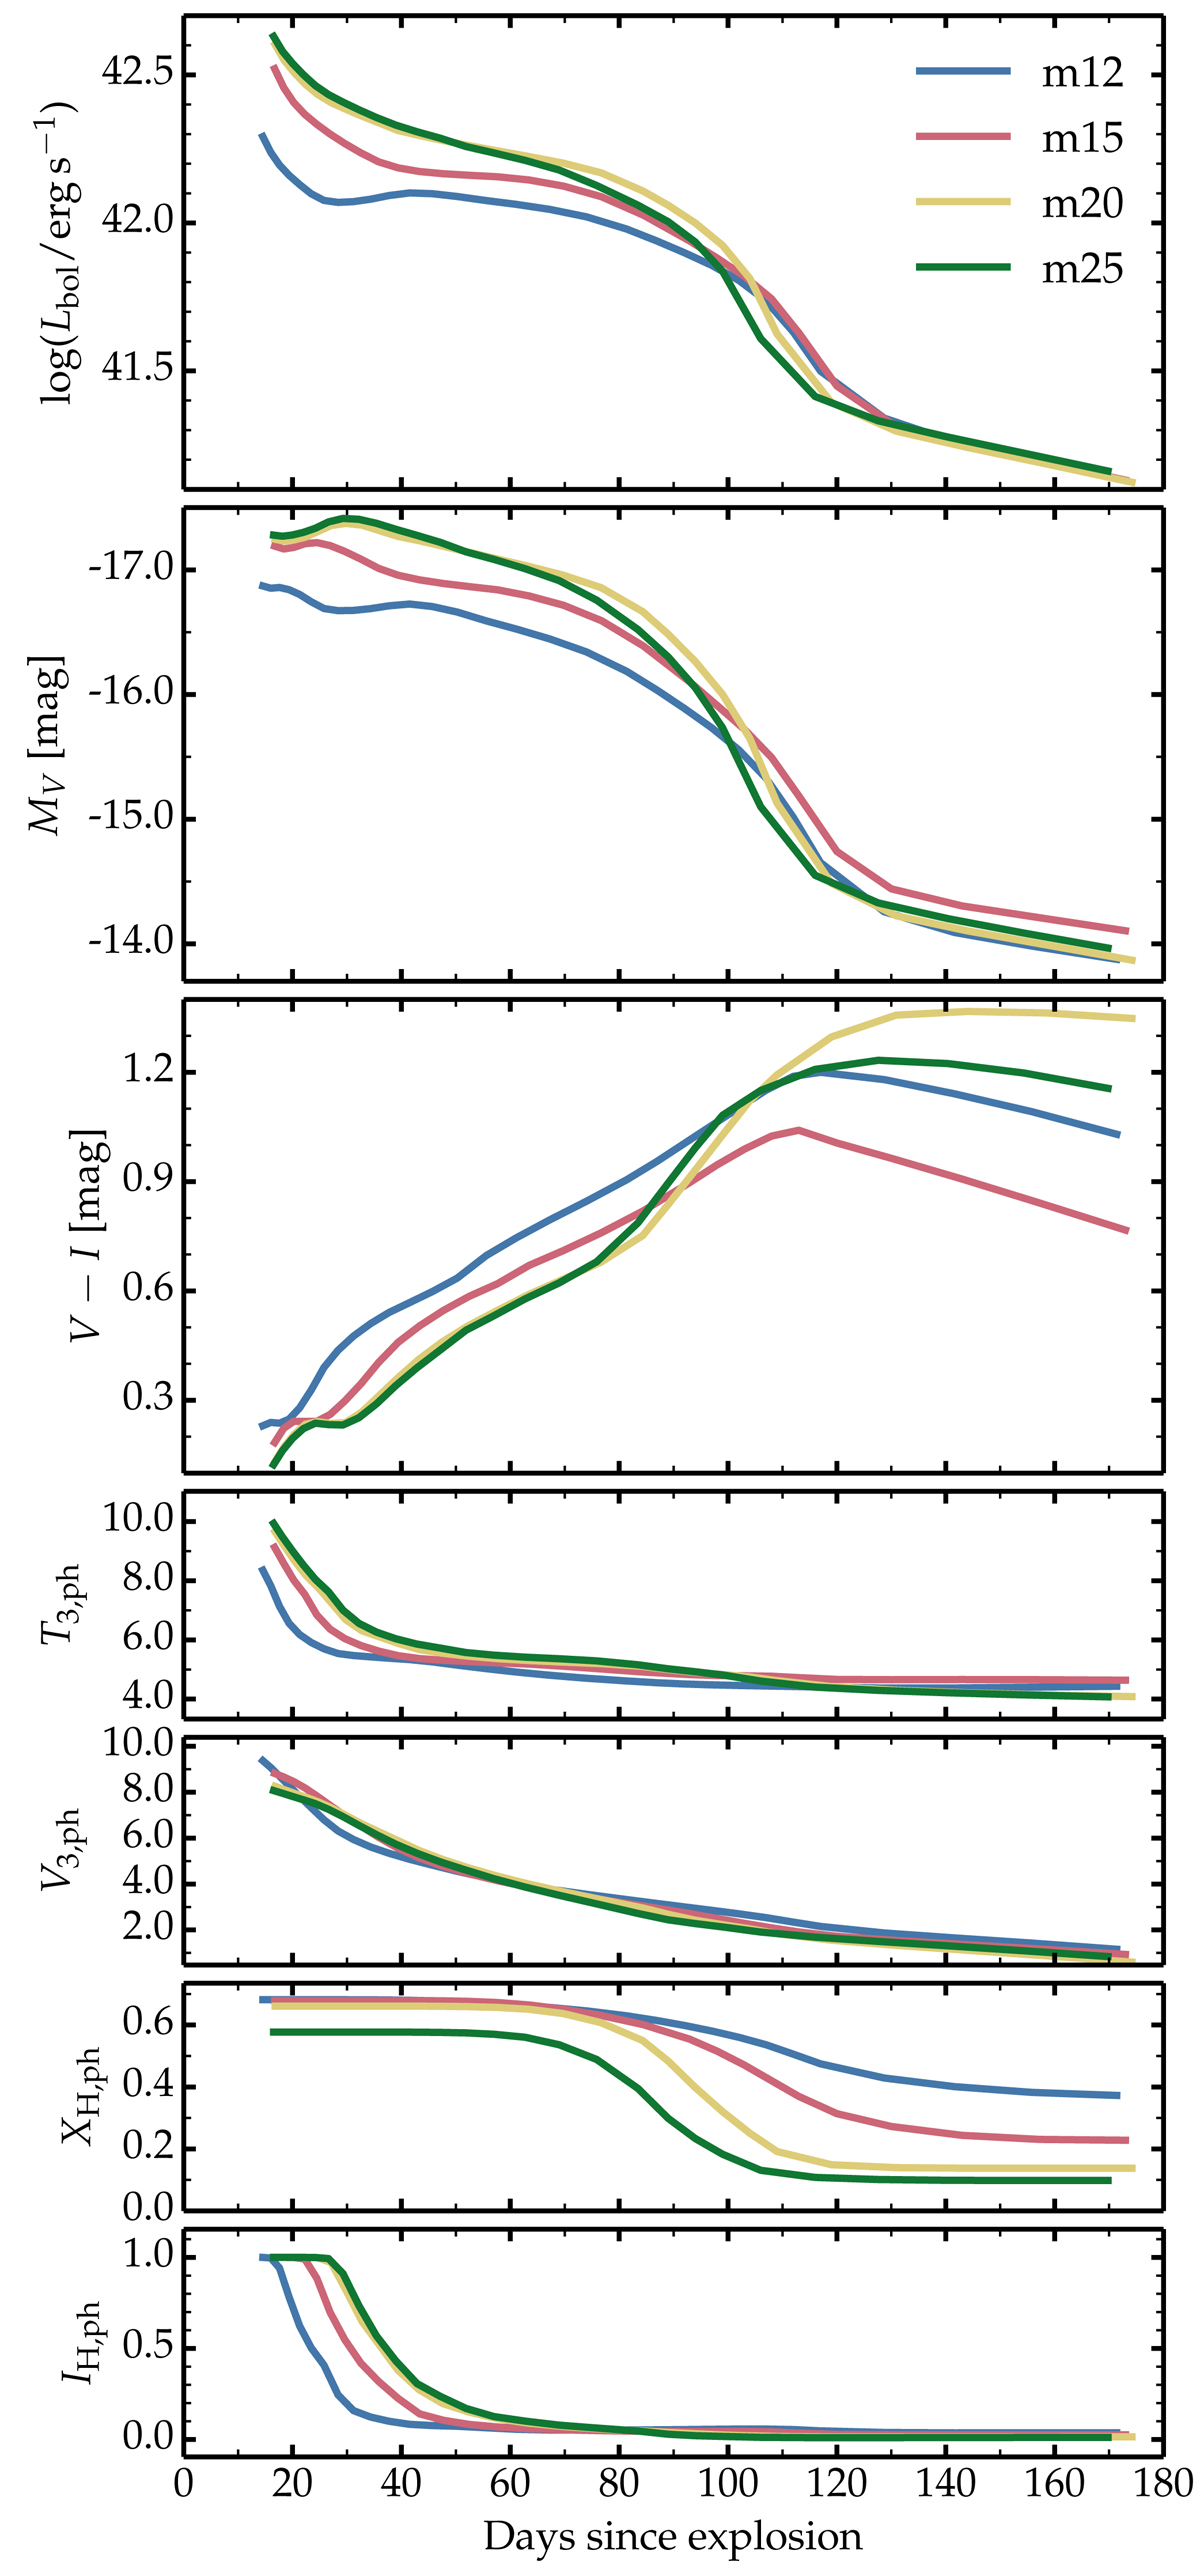
Summary of results from the CMFGEN simulations of models m12, m15, m20, and m25, showing, from top to bottom, the bolometric light curve, the V-band light curve, the V − I color evolution, and the evolution of some photospheric properties (T3, ph: temperature in units of 1000 K; V3, ph: velocity in units of 1000 km s−1; XH, ph: hydrogen mass fraction; IH, ph: hydrogen ionization state).
Current usage metrics show cumulative count of Article Views (full-text article views including HTML views, PDF and ePub downloads, according to the available data) and Abstracts Views on Vision4Press platform.
Data correspond to usage on the plateform after 2015. The current usage metrics is available 48-96 hours after online publication and is updated daily on week days.
Initial download of the metrics may take a while.