Fig. 4.
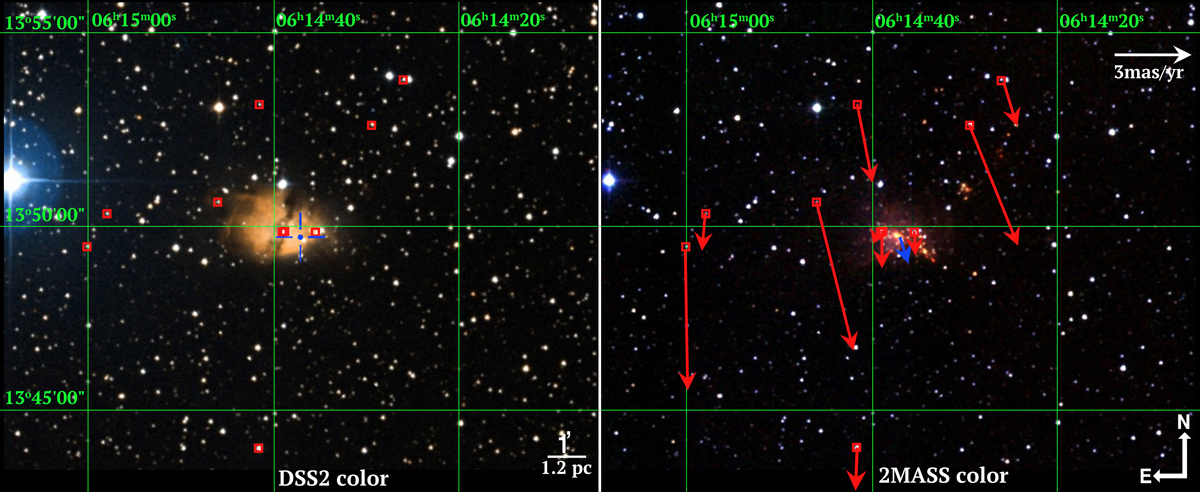
Image of the S 269 region using data from DSS2 (left panel) and 2MASS (right panel) with a sky projected size of 15.65′×12.33′, centered on the water maser emission (blue central sign) detected with the VLBA (Table 1), that seems to be triggered by the massive young star S 269 IRS 2w (Asaki et al. 2014). Left panel: the molecular cloud appears as a butterfly with two wings separated by a dark fringe where a B0.5 star has been detected in the center (Moffat et al. 1979). In contrast, near-infrared observations (right panel) show that the center of the clustered region of massive young objects coincides with the position of S 269 IRS 2w. The red squares are the closest optical sources around S 269 found within the Gaia DR2 catalog (see Sects. 3.3 and 4.5) and their astrometric information is shown in Table A.2. The red arrows display the proper motions for such sources, whereas the blue arrow is the proper motion calculated by us using the water masers in the region. The images were generated with the Aladdin interface (Bonnarel et al. 2000), where the color map descriptions of DSS2 and 2MASS can be found through alasky.u-strasbg.fr/DSS/DSSColor/ and alasky.u-strasbg.fr/2MASS/Color/.
Current usage metrics show cumulative count of Article Views (full-text article views including HTML views, PDF and ePub downloads, according to the available data) and Abstracts Views on Vision4Press platform.
Data correspond to usage on the plateform after 2015. The current usage metrics is available 48-96 hours after online publication and is updated daily on week days.
Initial download of the metrics may take a while.