Fig. 2.
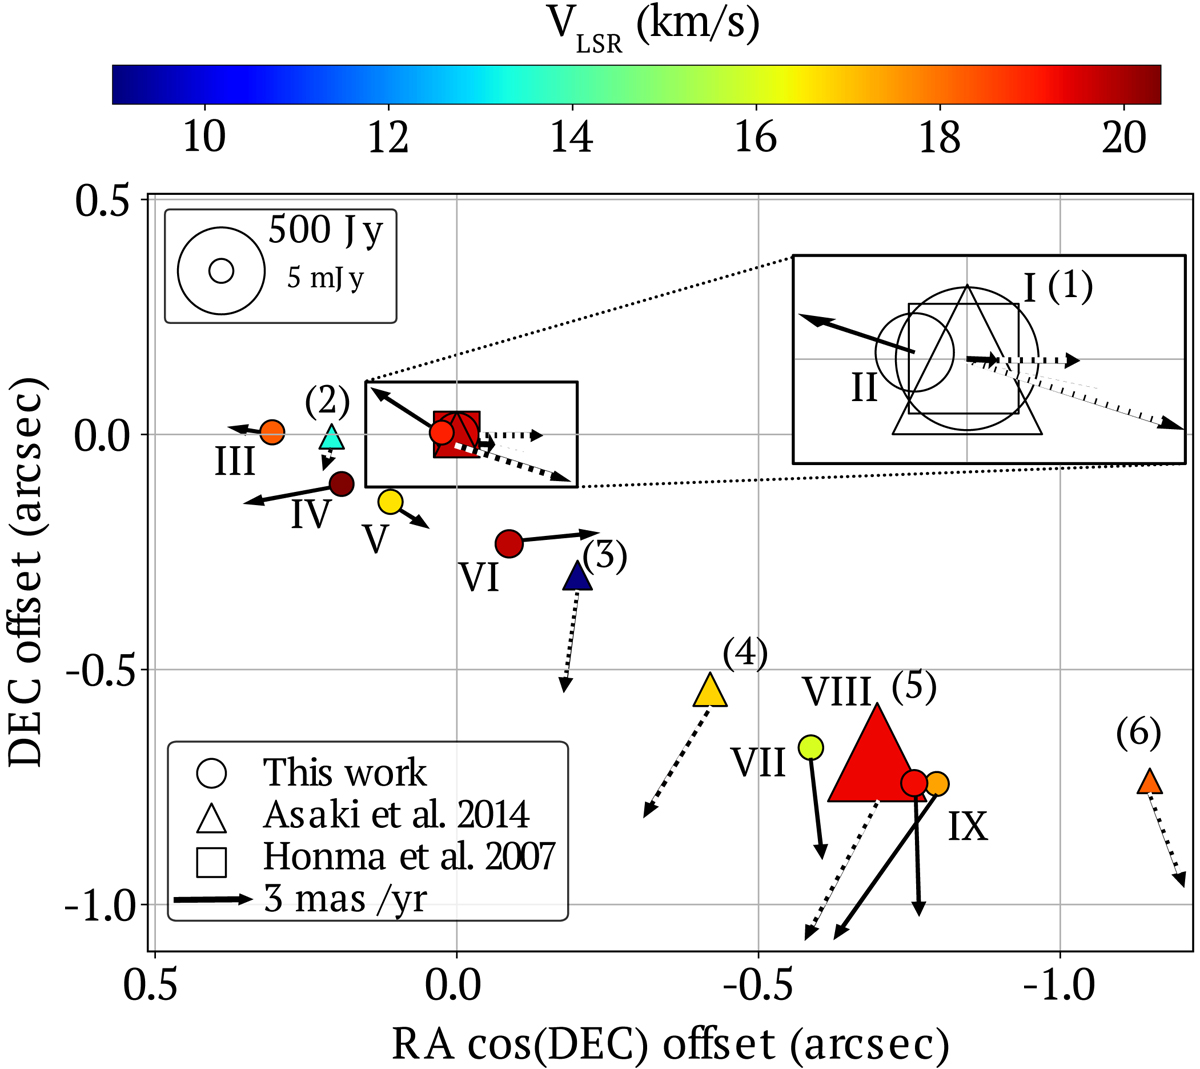
Distribution of water maser spots around the strongest maser emission (where several maser spots coincide, see zoom in) with their radial velocity values expressed using a color scheme indicated by the bar at the top. The maser spots detected by the VLBA in 2015–2016 (see Table 2) are shown as circles, with Roman numbers and their proper motion as continuum arrows. Whereas, the main maser spots detected by VERA in 2004–2005 and published by Honma et al. (2007) and Asaki et al. (2014) are shown as squares and triangles, with Arabic numerals and their proper motion as dashed arrows. The size of the markers is proportional to the flux density peak of each maser spot (see upper left corner convention).
Current usage metrics show cumulative count of Article Views (full-text article views including HTML views, PDF and ePub downloads, according to the available data) and Abstracts Views on Vision4Press platform.
Data correspond to usage on the plateform after 2015. The current usage metrics is available 48-96 hours after online publication and is updated daily on week days.
Initial download of the metrics may take a while.