Fig. 1.
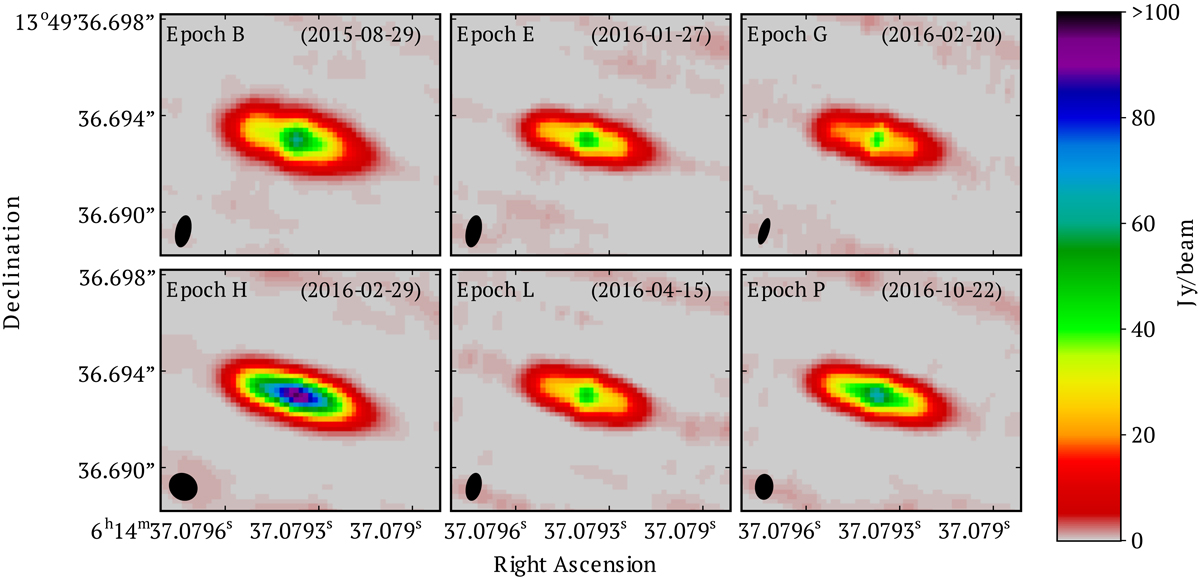
Strongest 22 GHz maser spot in S 269 region showing an elongated shape at six different epochs in the VLBA observations between 2015 and 2016. Based on its position and VLSR (but not its motion, see Sect. 4.1), it seems to correspond to the strongest maser spot reported by Honma et al. (2007), using VERA observations in 2004 and 2005. This maser spot corresponds to the spot I in Fig. 2. The shape and size of the beam for each epoch is shown in the bottom left corner.
Current usage metrics show cumulative count of Article Views (full-text article views including HTML views, PDF and ePub downloads, according to the available data) and Abstracts Views on Vision4Press platform.
Data correspond to usage on the plateform after 2015. The current usage metrics is available 48-96 hours after online publication and is updated daily on week days.
Initial download of the metrics may take a while.