Fig. 5.
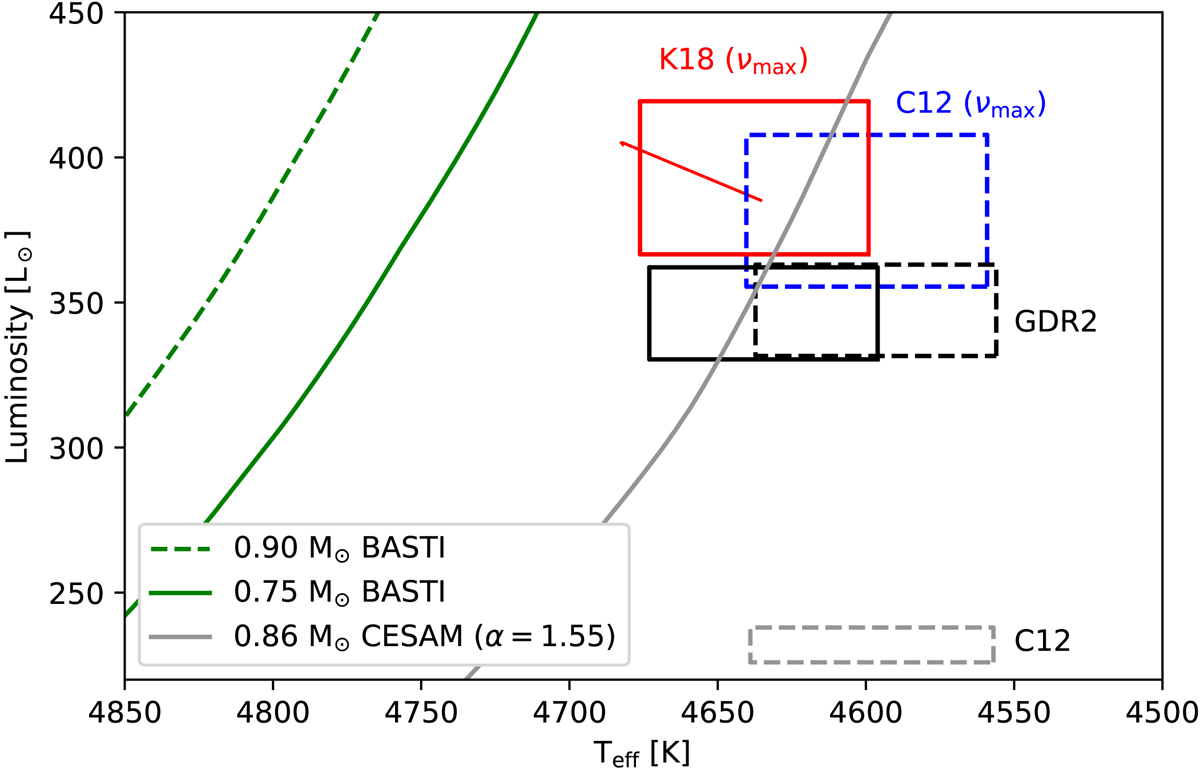
HR diagram presenting the revised positions of HD 122563 based on asteroseismic data (red and blue) and Gaia data (black) for K18 and C12 (continuous and dashed lines, respectively). The value presented in C12 using the parallax from van Leeuwen (2007) is shown with the grey dashed box. The red vector represents a potential shift in the median values of L⋆ and Teff if we consider an extinction AV = 0.08 mag (the reference value is 0.01 mag). Classical evolution tracks for a 0.75 and 0.90 ℳ⊙ model from BASTI (Pietrinferni et al. 2004) are shown by the green lines, while a fine-tuned 0.86 ℳ⊙ model using the CESAM2K evolution code (Morel 1997) with a reduced value of the mixing-length parameter compared to the solar one is shown by the grey continuous curve. See Sect. 4 for details.
Current usage metrics show cumulative count of Article Views (full-text article views including HTML views, PDF and ePub downloads, according to the available data) and Abstracts Views on Vision4Press platform.
Data correspond to usage on the plateform after 2015. The current usage metrics is available 48-96 hours after online publication and is updated daily on week days.
Initial download of the metrics may take a while.