Fig. 3.
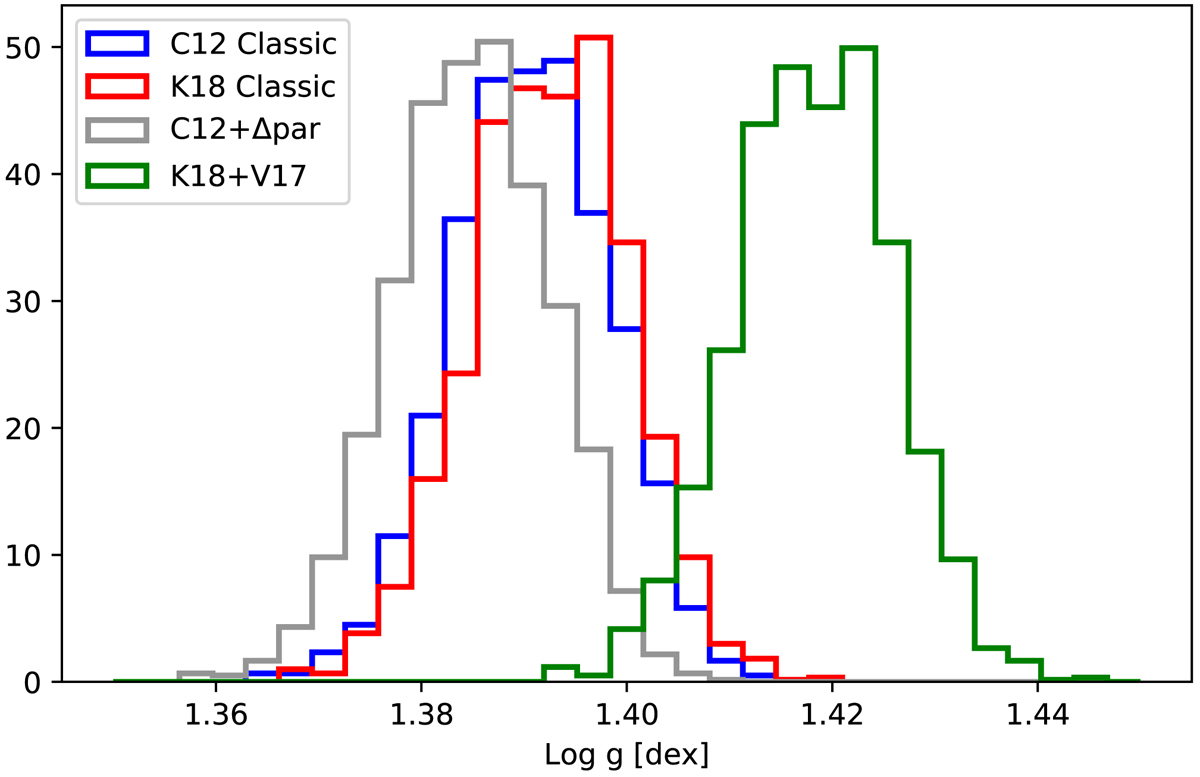
Distributions of log g derived from asteroseismic data using the seismic scaling relation. The blue and red represent the results using the observed properties from C12 and K18, respectively, and fνmax = 1.0. The grey and green lines show log g using the different solar reference values and a revised scaling relation (Viani et al. 2017), respectively. See Sect. 3.1 for details.
Current usage metrics show cumulative count of Article Views (full-text article views including HTML views, PDF and ePub downloads, according to the available data) and Abstracts Views on Vision4Press platform.
Data correspond to usage on the plateform after 2015. The current usage metrics is available 48-96 hours after online publication and is updated daily on week days.
Initial download of the metrics may take a while.