Fig. 5
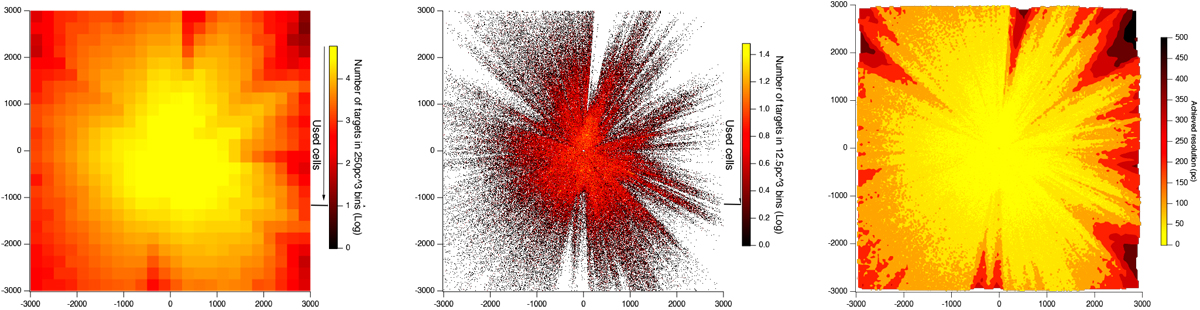
Left panel: 250 × 250 × 250 pc bins similar in volume to those used in the first step of the inversion. Shown are the cells centered on the Plane. The Sun is at the center of the figure at (0,0). The Galactic center is to the right. The colorcode corresponds to the number of target stars per bin, i.e., a quantity proportional to the targetspace density. Only bins with more than ten targets are used at this stage. Middle panel: 12.5 × 12.5 × 12.5 pc bins used in the last step of the inversion. Only bins with more than two targets are used. Right panel: resolution achieved in the Plane based on the hierarchical inversion. In regions of high target space density, essentially close to the Sun, the resolution is 25 pc and is achieved after the last step. In regions of scarce targets, mainly at large distances, the resolution is coarse, may reach 500 pc, and is achieved at the first steps. These regions are not improved during the following steps.
Current usage metrics show cumulative count of Article Views (full-text article views including HTML views, PDF and ePub downloads, according to the available data) and Abstracts Views on Vision4Press platform.
Data correspond to usage on the plateform after 2015. The current usage metrics is available 48-96 hours after online publication and is updated daily on week days.
Initial download of the metrics may take a while.