Open Access
Fig. 3
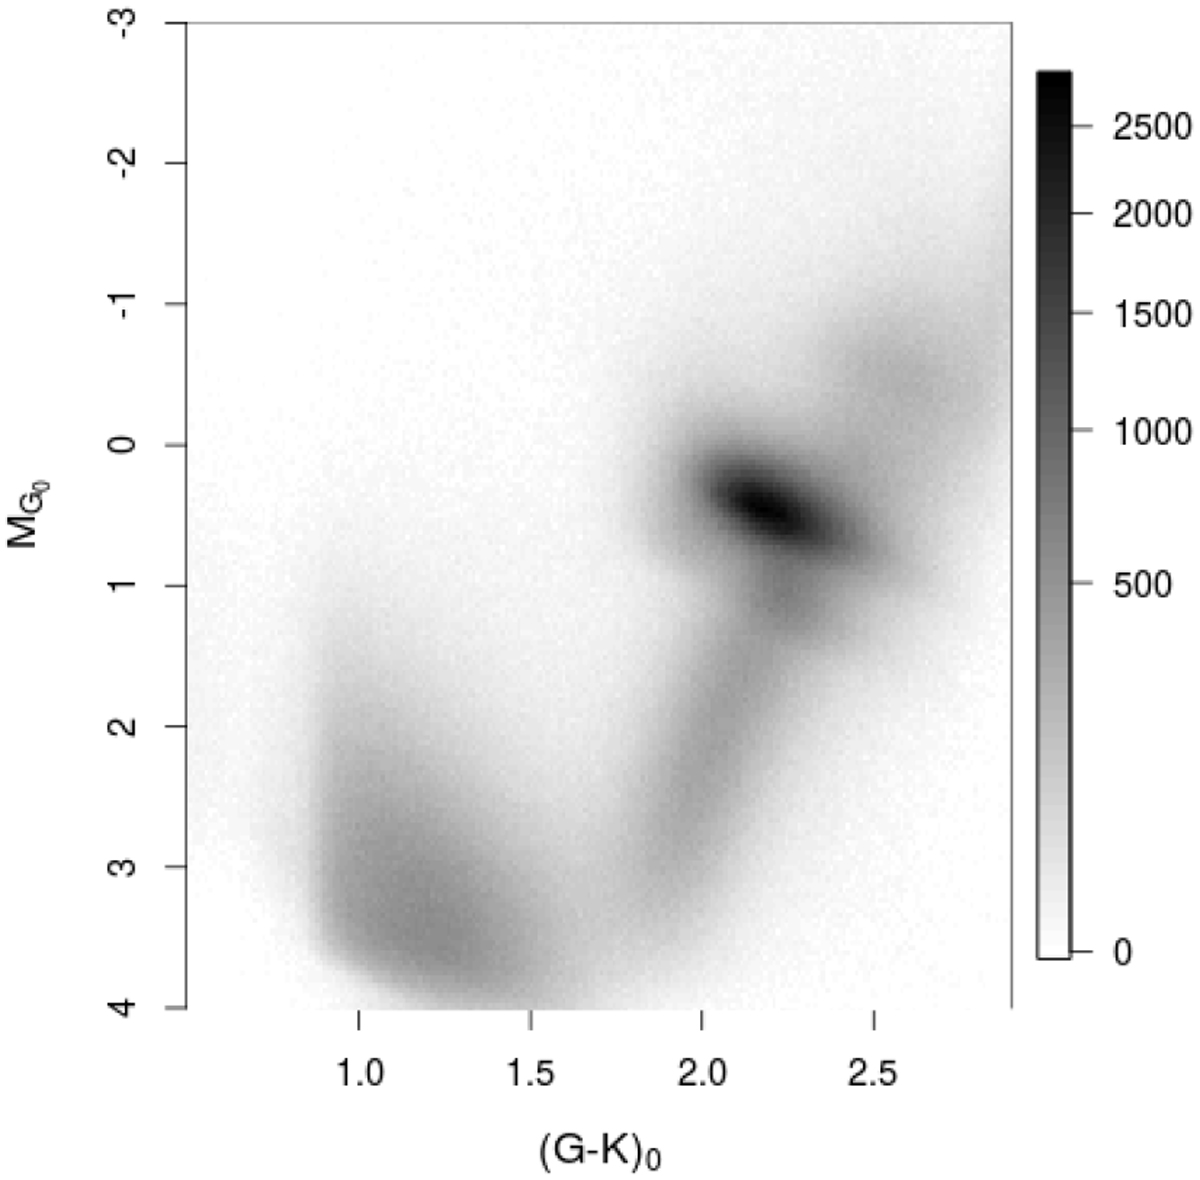
Dereddened Hess diagram for a subset of stars with a relative parallax uncertainty smaller than 10%. The grayscale corresponds to the square root of the stellar density. The Red Clump is the most prominent feature. Its shape can be compared to Fig. 2 of Ruiz-Dern et al. (2018).
Current usage metrics show cumulative count of Article Views (full-text article views including HTML views, PDF and ePub downloads, according to the available data) and Abstracts Views on Vision4Press platform.
Data correspond to usage on the plateform after 2015. The current usage metrics is available 48-96 hours after online publication and is updated daily on week days.
Initial download of the metrics may take a while.