Fig. A.1
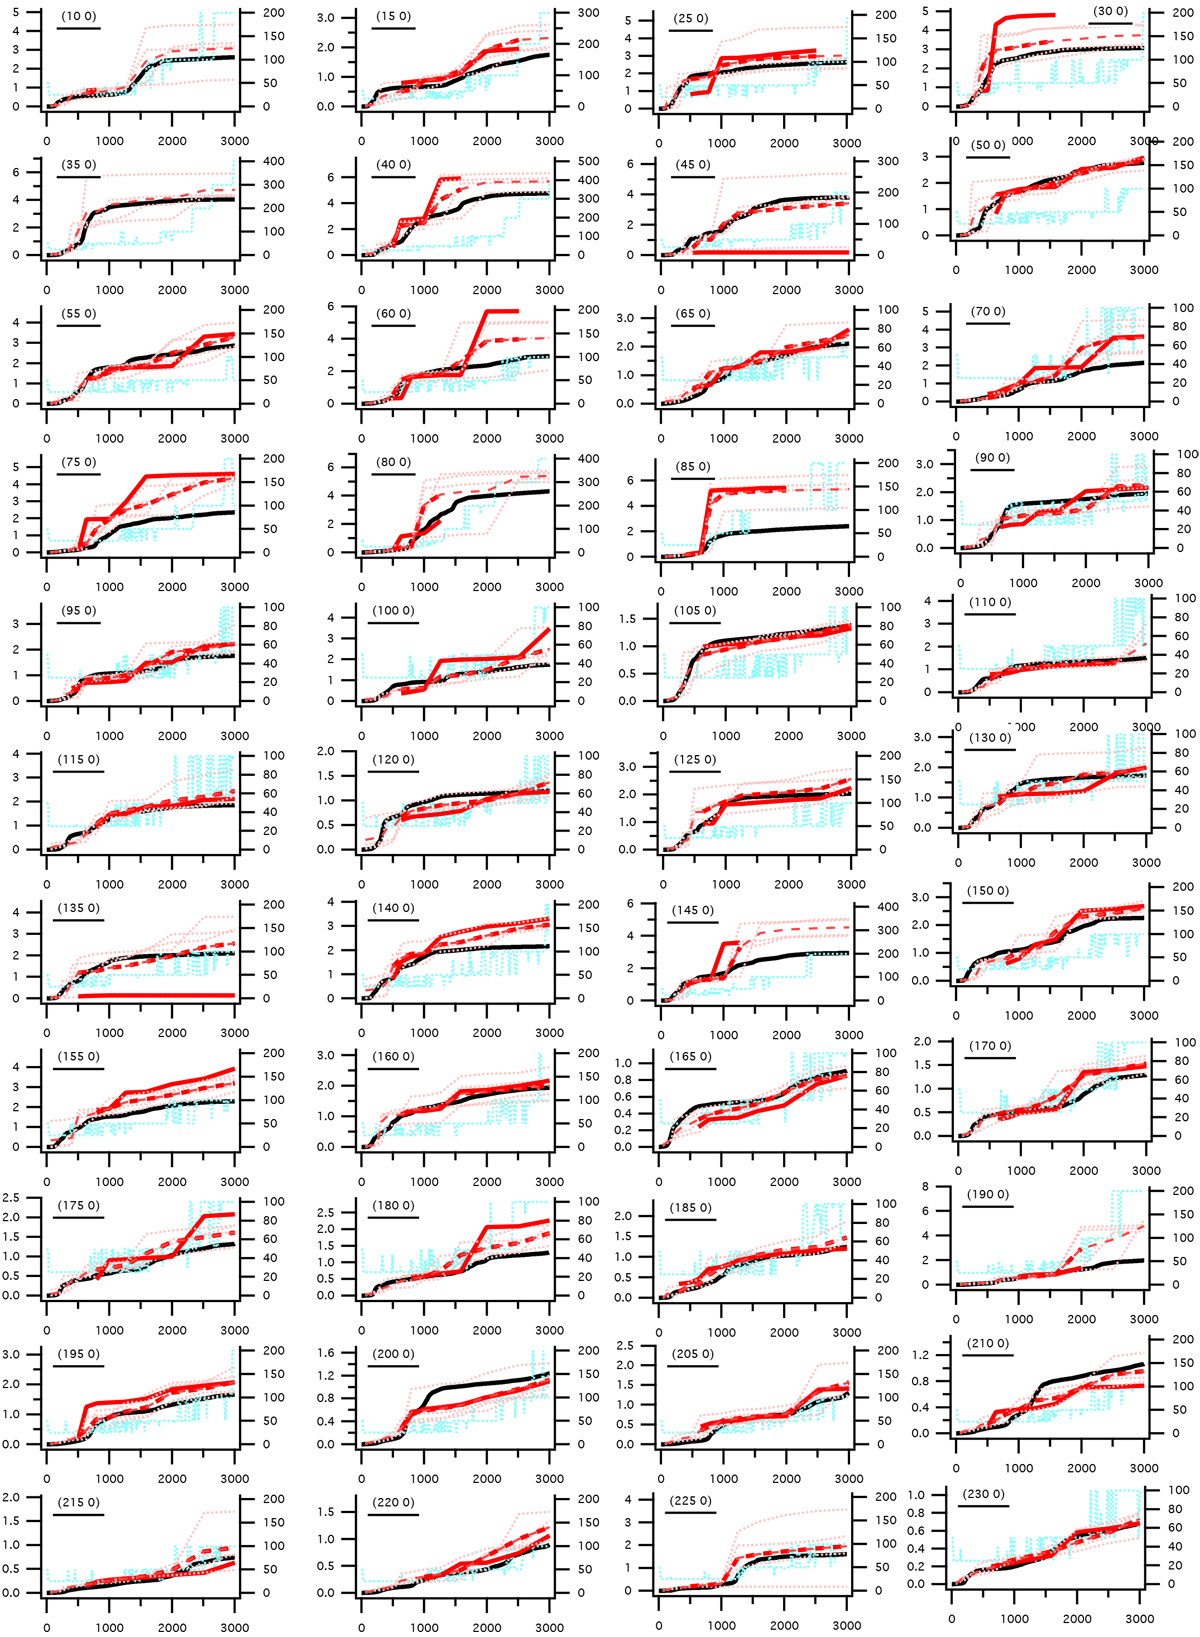
Extinction profiles integrated through the 3D distribution of differential extinction for sightlines within the Plane (black) and reddening profiles from Green et al. (2018) scaled to A0 (see text, red solid line). We also show the Green et al. (2018) profiles for four surrounding directions at ±0.25° in longitude and latitude (dotted red line) and their average in non-flagged and all intervals (thick and thin dashed red line, respectively). Our achieved resolution (see Sect. 3) is also shown (pale blue line, right scale. Coordinates are indicated in the graph.
Current usage metrics show cumulative count of Article Views (full-text article views including HTML views, PDF and ePub downloads, according to the available data) and Abstracts Views on Vision4Press platform.
Data correspond to usage on the plateform after 2015. The current usage metrics is available 48-96 hours after online publication and is updated daily on week days.
Initial download of the metrics may take a while.