Free Access
Fig. C.2.
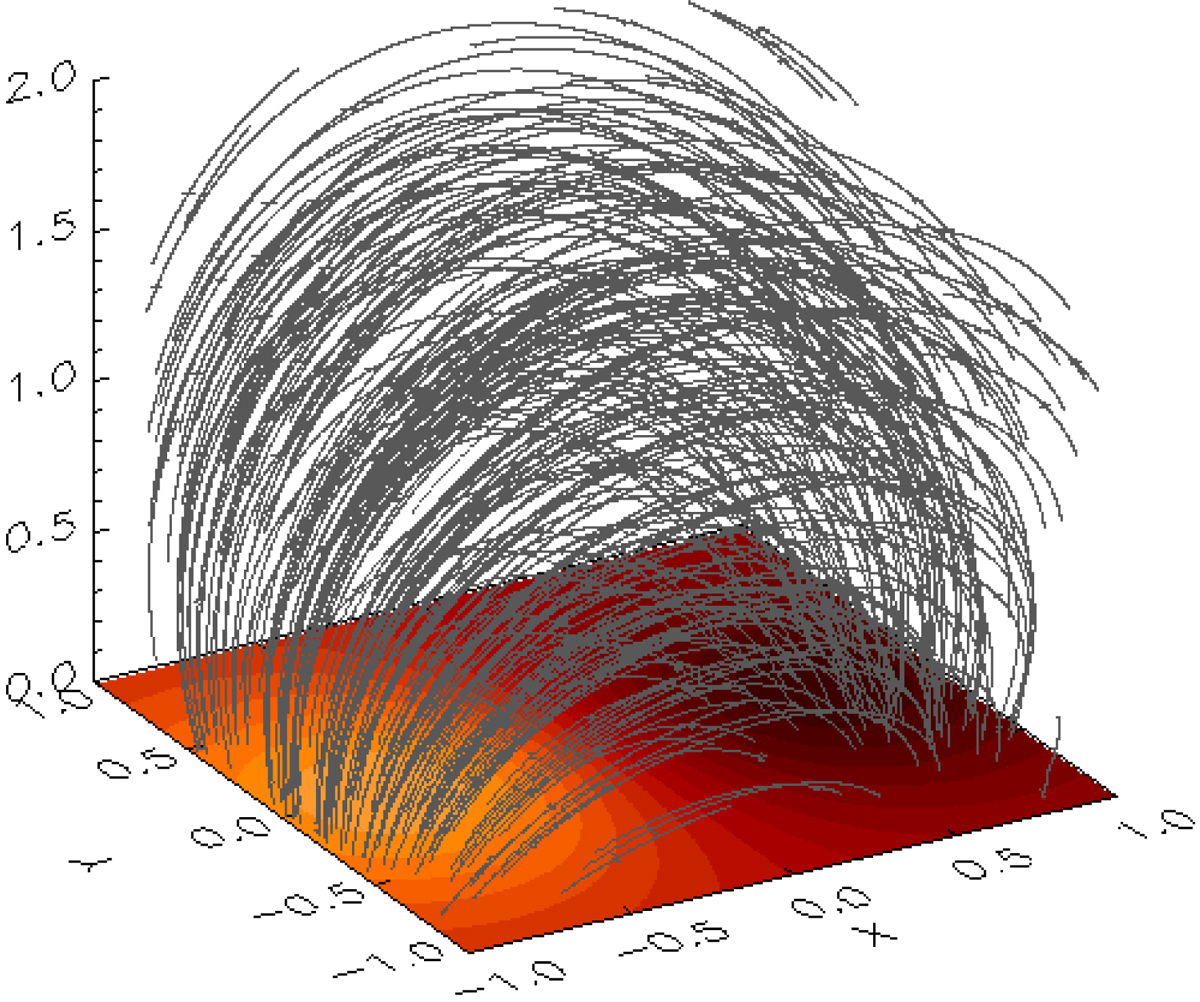
Field line diagram of a potential bipole field visualised with Boobox.pro with GRID=0. We can clearly see that the field strength is greater closer to the poles at the photosphere.
Current usage metrics show cumulative count of Article Views (full-text article views including HTML views, PDF and ePub downloads, according to the available data) and Abstracts Views on Vision4Press platform.
Data correspond to usage on the plateform after 2015. The current usage metrics is available 48-96 hours after online publication and is updated daily on week days.
Initial download of the metrics may take a while.