Fig. 6.
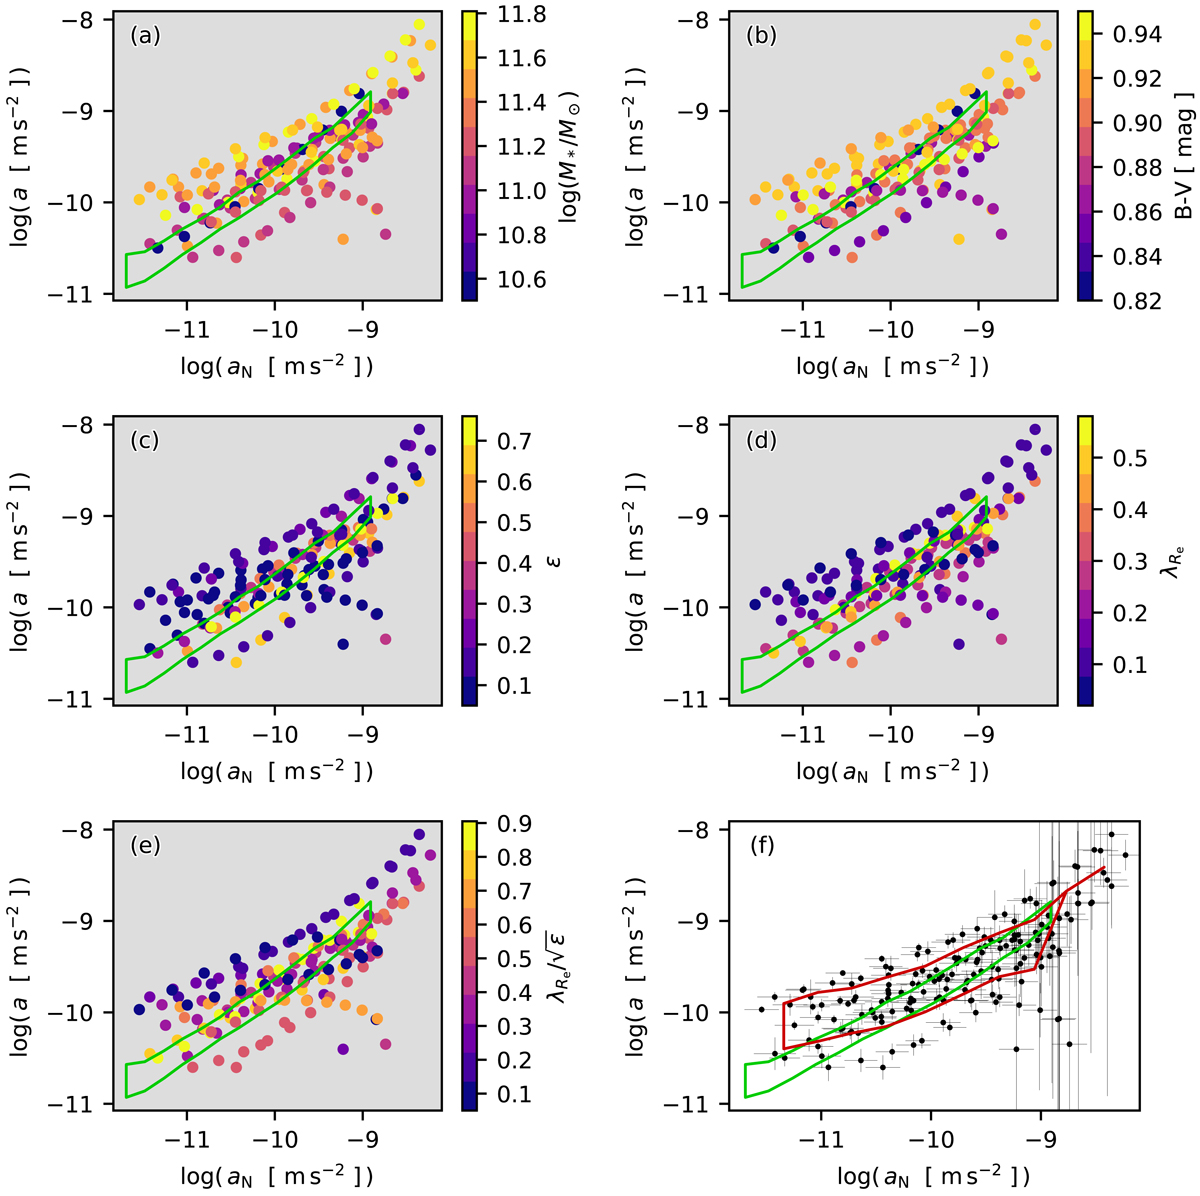
Comparison of the RARs of the individual ETGs (colored points) and to the RAR of the LTGs (green region). The vertical thickness corresponds to the 1σ scatter (McGaugh et al. 2016). The points in panels a–e are colored with respect to the properties of their galaxy. Panel a – stellar mass of the galaxy (derived for d0 and M/L0 defined in Sect. 5); panel b – color index B − V of the galaxy; panel c – galaxy ellipticity ϵ; panel d – degree of rotational support λRe (Eq. (24)); panel e – rotator criterion number ![]() . Panel f – the error bars and, as the red region, the 1σ intrinsic scatter in the reconstructed collective RAR of the ETGs. The deviation of the ETG RARs from the LTG RAR increases with their characteristics approaching to those of galaxies in galaxy cluster centers.
. Panel f – the error bars and, as the red region, the 1σ intrinsic scatter in the reconstructed collective RAR of the ETGs. The deviation of the ETG RARs from the LTG RAR increases with their characteristics approaching to those of galaxies in galaxy cluster centers.
Current usage metrics show cumulative count of Article Views (full-text article views including HTML views, PDF and ePub downloads, according to the available data) and Abstracts Views on Vision4Press platform.
Data correspond to usage on the plateform after 2015. The current usage metrics is available 48-96 hours after online publication and is updated daily on week days.
Initial download of the metrics may take a while.