Fig. 10
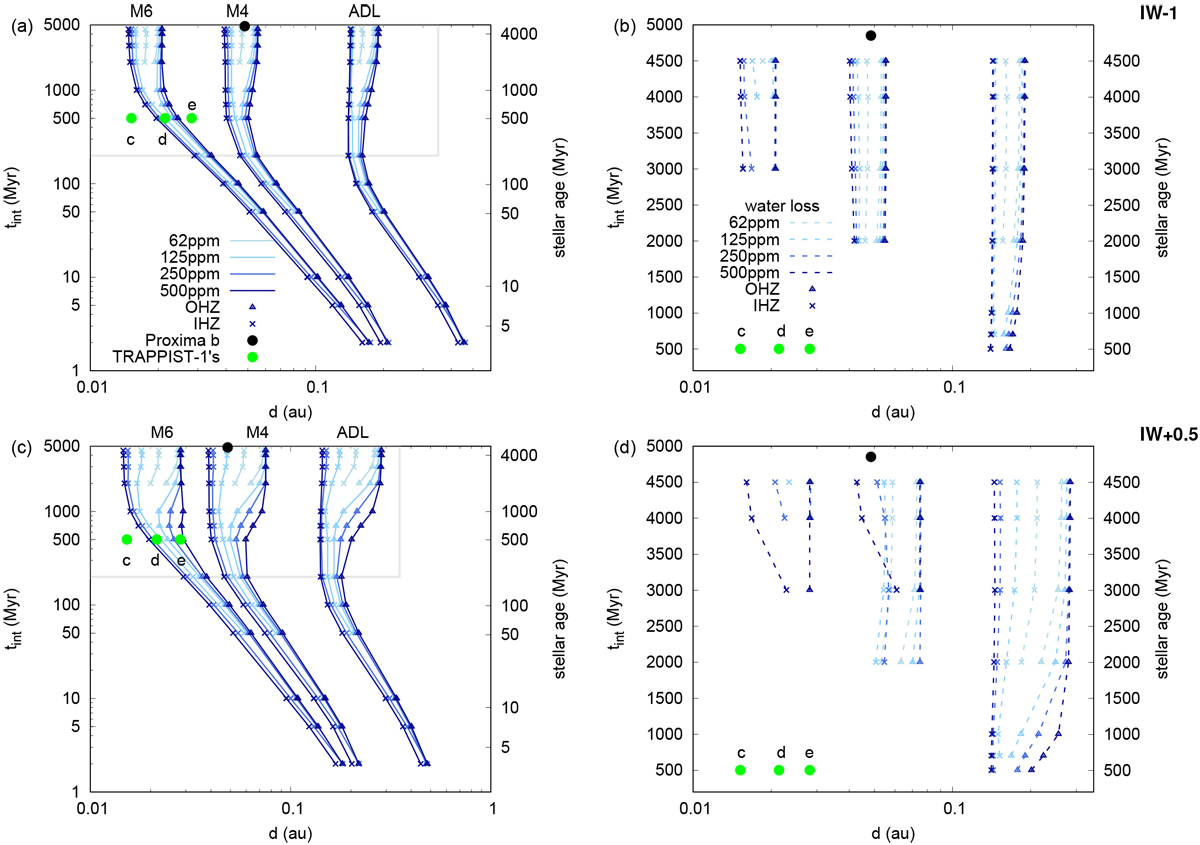
Habitable zone evolution for planets around the different M dwarfs with different initial water contents (see legend) and oxygen fugacities, upper panels (a, b) IW − 1, lower panels (c, d) IW + 0.5 Left panels: HZ evolution for the full outgassed amounts of H2O and CO2. Right panels: HZ boundaries assuming that all water outgassed during the pre-main sequence phase of the star has been lost for each initial water concentration. For better visibility the y-axis has been changed to linear scale in the right panels. The locations of Proxima Centauri b and TRAPPIST-1c, d, and e are also shown. The grey box in the left panels indicates the time and distance range shown in the right panels.
Current usage metrics show cumulative count of Article Views (full-text article views including HTML views, PDF and ePub downloads, according to the available data) and Abstracts Views on Vision4Press platform.
Data correspond to usage on the plateform after 2015. The current usage metrics is available 48-96 hours after online publication and is updated daily on week days.
Initial download of the metrics may take a while.