Fig. 9
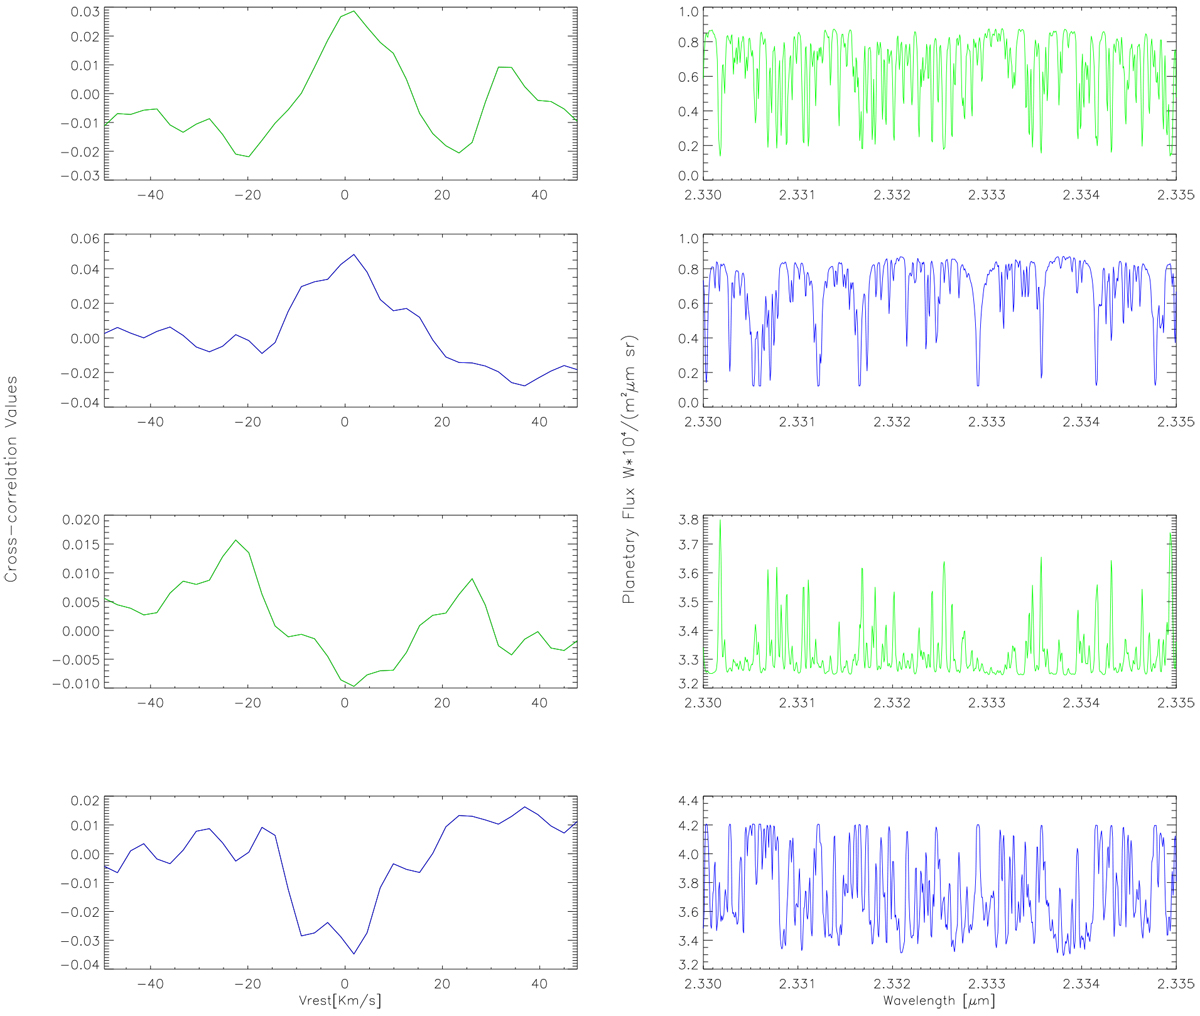
Left panels: total cross-correlation values in the neighborhood of V rest ~ 0. Right panels: theoretical models they correspond to. We use the best models containing methane only (in green, first panels), and water vapour only (in blue, second panels), and two models with temperature inversion with methane only, VMR ~ 10−5, (in green, third panels), and water vapor only, VMR ~ 10−3, (in blue, fourth panels). Since the emission lines in the models with temperature inversion correlated negatively with the absorption lines in the observed planetary spectrum, unlike the absorption lines in the noninverted models, we can infer a noninverted temperature profile for HD 102195b.
Current usage metrics show cumulative count of Article Views (full-text article views including HTML views, PDF and ePub downloads, according to the available data) and Abstracts Views on Vision4Press platform.
Data correspond to usage on the plateform after 2015. The current usage metrics is available 48-96 hours after online publication and is updated daily on week days.
Initial download of the metrics may take a while.