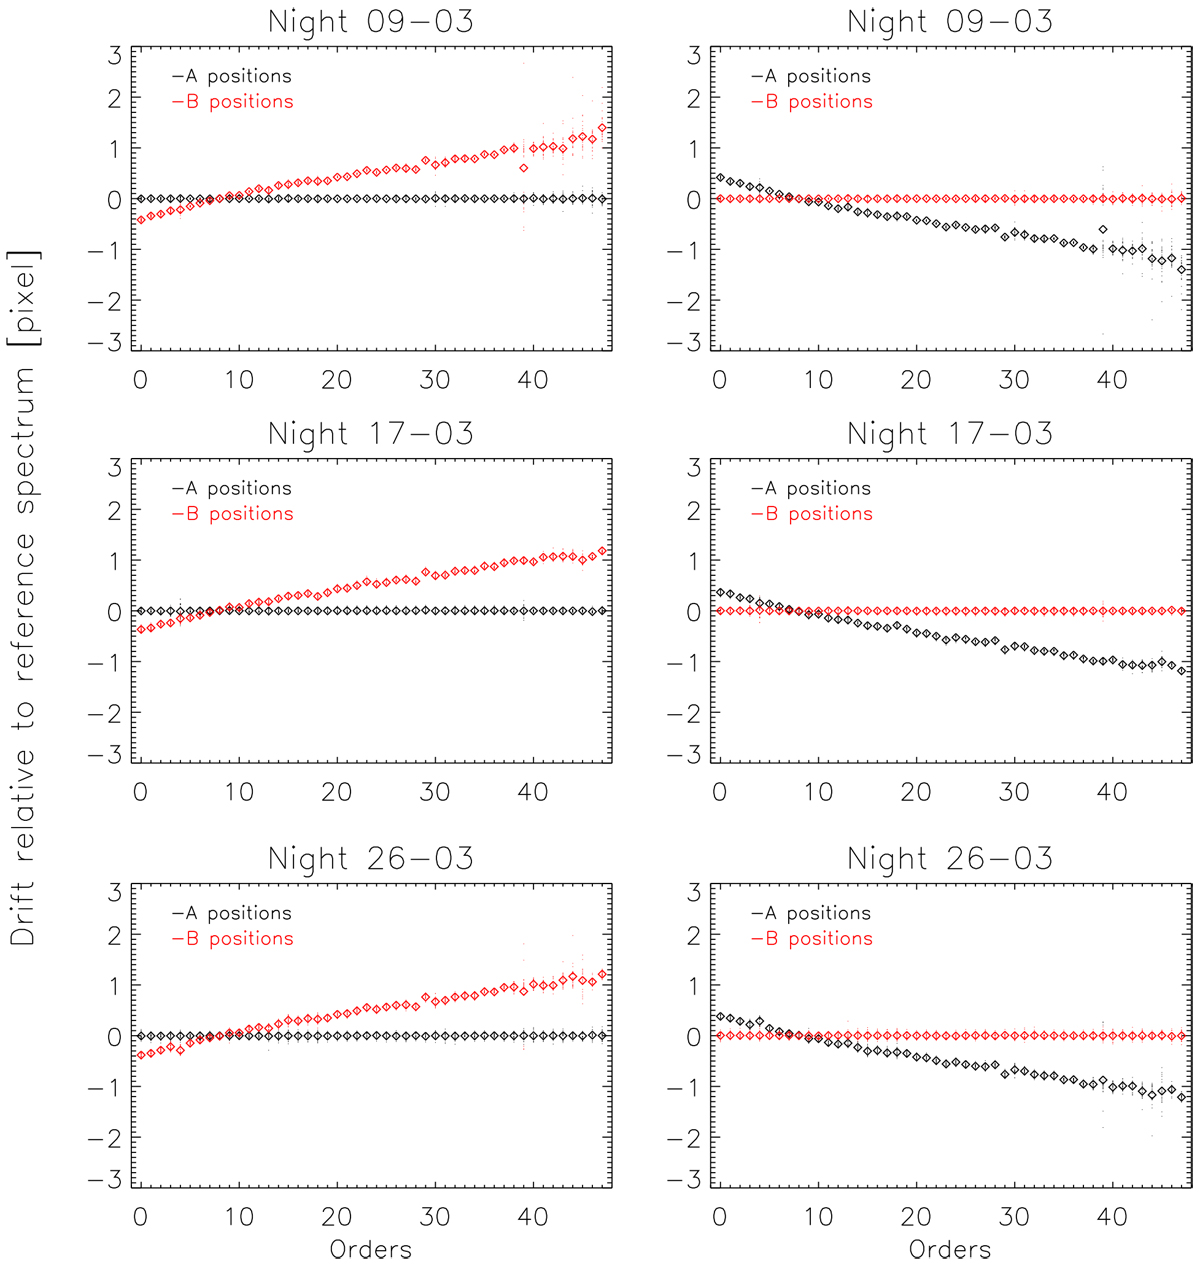
Fig. 2

For each order, we plot the average shift (diamonds) over time (dots). The drift relative to the reference spectrum is expressed in pixels (1 pixel equals to 2.7 km s−1). In the left panels, for the three nights, we have taken as reference spectrum the average over the spectra taken in position A (in black) while in the right panels the average over the spectra taken in position B (in red). The average shifts of the spectra over time acquired with one nodding position are shifted with respect to those taken in the other position. These shifts present themselves in a linear fashion, as a function of spectral order. The amplitude of the shifts does not depend on the night considered.
Current usage metrics show cumulative count of Article Views (full-text article views including HTML views, PDF and ePub downloads, according to the available data) and Abstracts Views on Vision4Press platform.
Data correspond to usage on the plateform after 2015. The current usage metrics is available 48-96 hours after online publication and is updated daily on week days.
Initial download of the metrics may take a while.


