Fig. 11
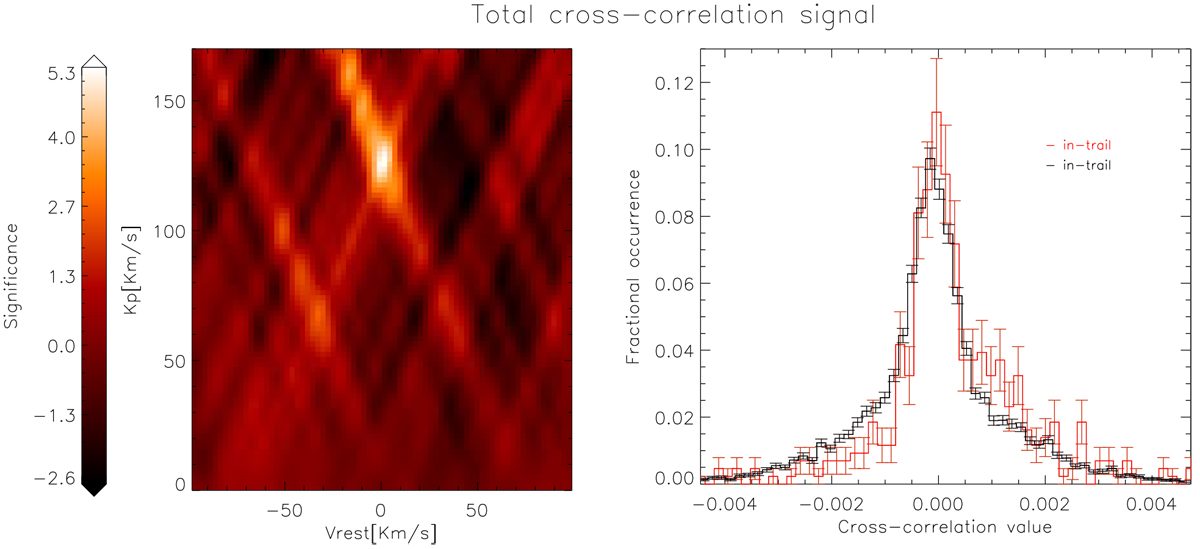
Significance of the cross-correlation detection. Right panel: difference between the aligned CCF distributions “in-trail” (red-line) and “out-of-trail” (black-line) for the derived KP. The two distributions are normalized and the error bars correspond to the square-root of the bin occurrences. The in-trail distribution is centered to higher values than the out-of-trail distribution with a 5.3 σ confidence level. Left panel: results of the Welch t-test performed for the same range of vrest and KP as before.
Current usage metrics show cumulative count of Article Views (full-text article views including HTML views, PDF and ePub downloads, according to the available data) and Abstracts Views on Vision4Press platform.
Data correspond to usage on the plateform after 2015. The current usage metrics is available 48-96 hours after online publication and is updated daily on week days.
Initial download of the metrics may take a while.