Free Access
Fig. 3.
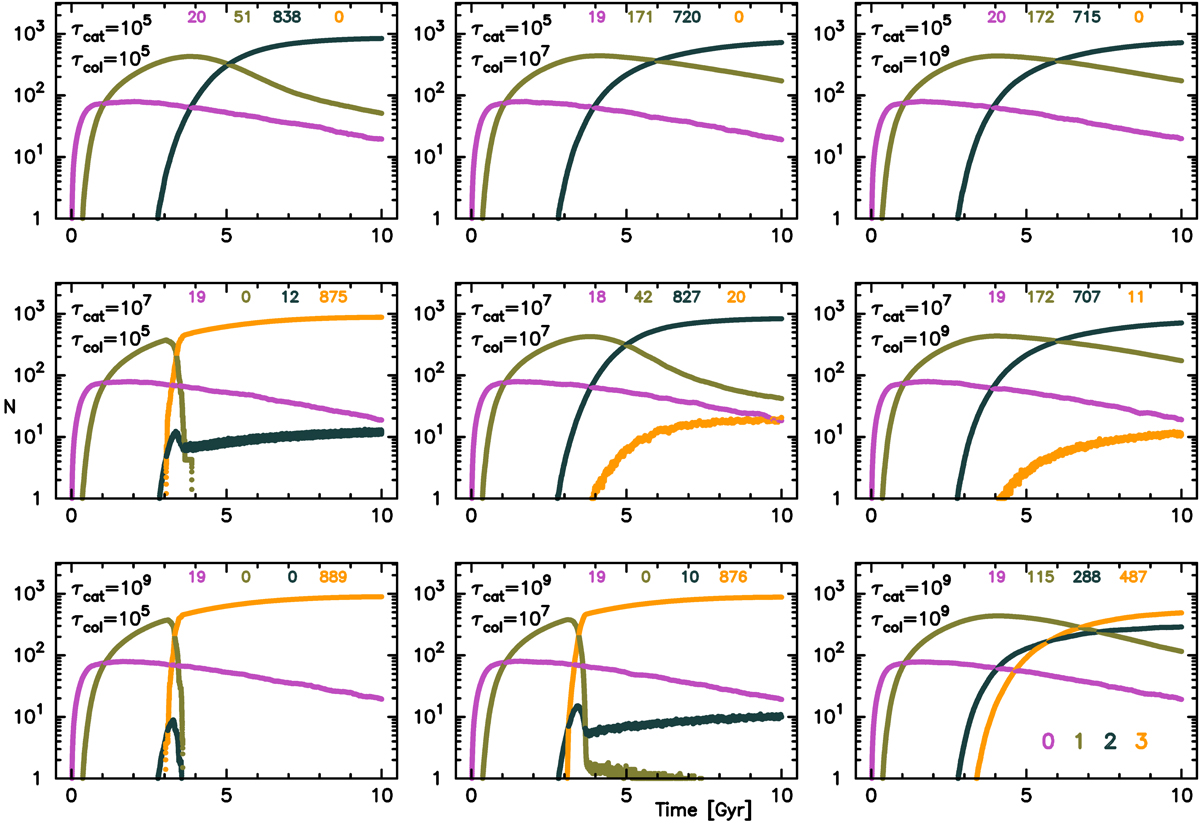
Number of cells in each state (colour-coded as listed in bottom right panel) as a function of time. Different plots means different initial conditions for colonization timescale (τcol) and catastrophism (τcat). The number of sites in each state after 10 Gyr is indicated at the top of each panel.
Current usage metrics show cumulative count of Article Views (full-text article views including HTML views, PDF and ePub downloads, according to the available data) and Abstracts Views on Vision4Press platform.
Data correspond to usage on the plateform after 2015. The current usage metrics is available 48-96 hours after online publication and is updated daily on week days.
Initial download of the metrics may take a while.