Fig. 2.
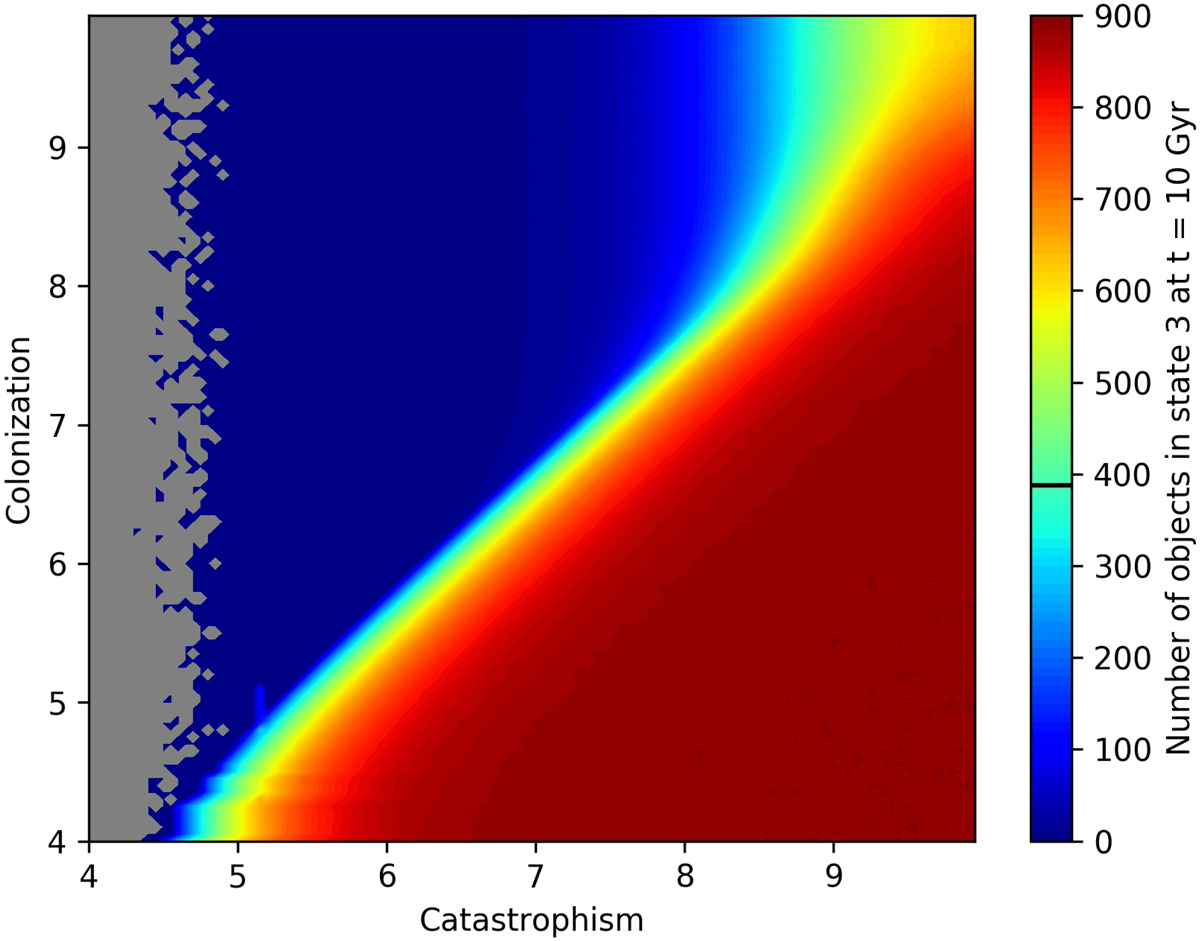
Number of sites in state 3 as a function of timescale for catastrophism and colonization at the end of the simulated time span (10 Gyr). Axes are designated with decadic logarithm of the relevant timescale in years. The grey colour represents pixels with exactly zero number of sites in state 3, while the numbers values higher than zero are colour-coded as displayed. The mean value of the plotted matrix is 391.90 and is indicated with the black dash on the colour bar.
Current usage metrics show cumulative count of Article Views (full-text article views including HTML views, PDF and ePub downloads, according to the available data) and Abstracts Views on Vision4Press platform.
Data correspond to usage on the plateform after 2015. The current usage metrics is available 48-96 hours after online publication and is updated daily on week days.
Initial download of the metrics may take a while.