Fig. 7
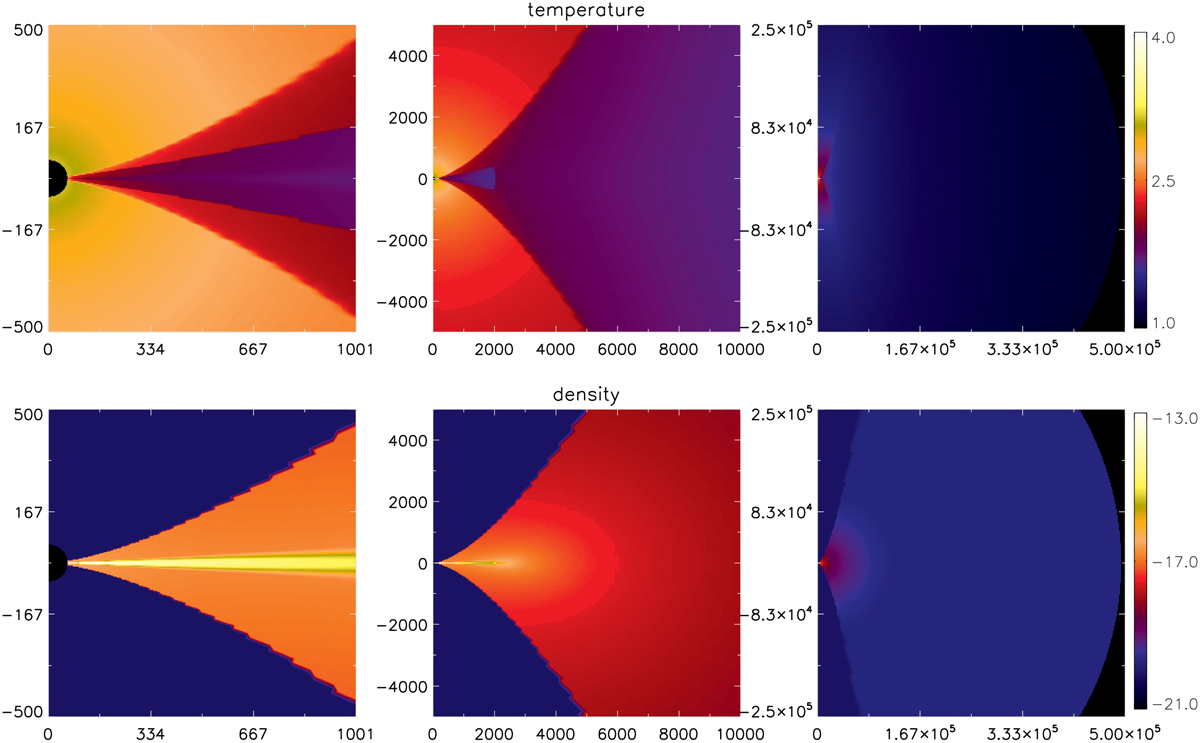
Cut-through, side-on, logarithmically-scaled maps of the temperature and density for the best-fitting model generated with Hochunk (plotted using IDL (IDL is a trademark of Exelis Visual Information Solutions, Inc.) post-processing scripts written by Whitney et al. 2013). The temperature colour-bar is in Kelvin and the density colour-bar is in g cm−3. The axes for all panels are in au. Each column of images represents a different scale, corresponding to the observations, with the smallest scales traced by MIDI on the left, larger scales traced by VISIR in the centre and the entire envelope displayed on the right.
Current usage metrics show cumulative count of Article Views (full-text article views including HTML views, PDF and ePub downloads, according to the available data) and Abstracts Views on Vision4Press platform.
Data correspond to usage on the plateform after 2015. The current usage metrics is available 48-96 hours after online publication and is updated daily on week days.
Initial download of the metrics may take a while.