Free Access
Fig. 5
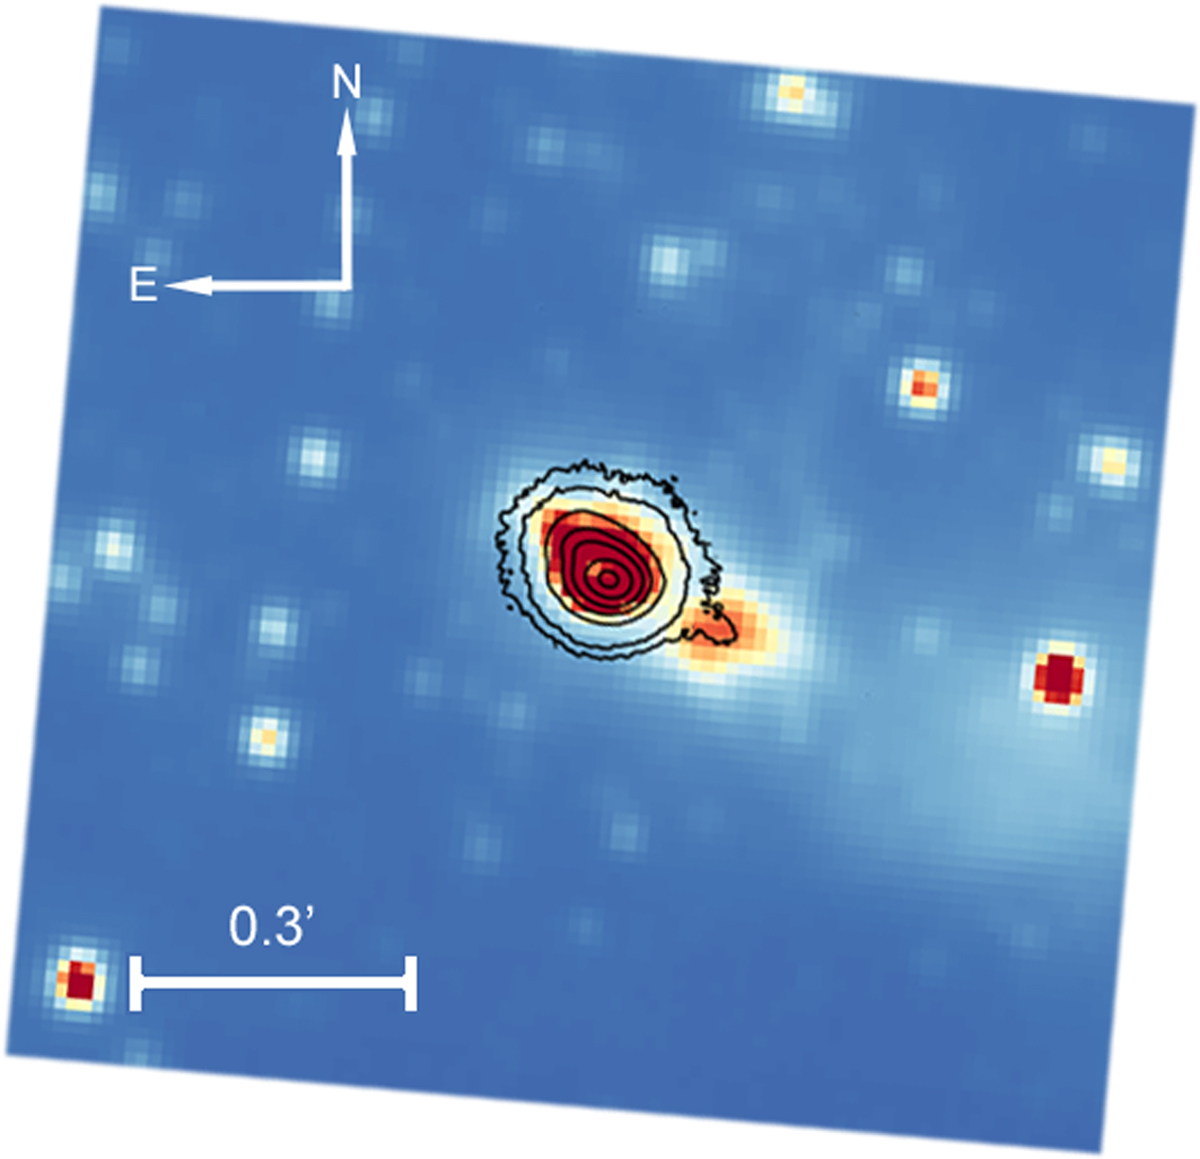
A combined image showing the location and morphology of our VISIR 19.5 μm image (black contours) in comparison to the structure observed in the VVV Ks-band image. The VISIR contours are 0.2, 0.5, 2, 5, 10, 25 and 75% of the peak flux.
Current usage metrics show cumulative count of Article Views (full-text article views including HTML views, PDF and ePub downloads, according to the available data) and Abstracts Views on Vision4Press platform.
Data correspond to usage on the plateform after 2015. The current usage metrics is available 48-96 hours after online publication and is updated daily on week days.
Initial download of the metrics may take a while.