Fig. 1
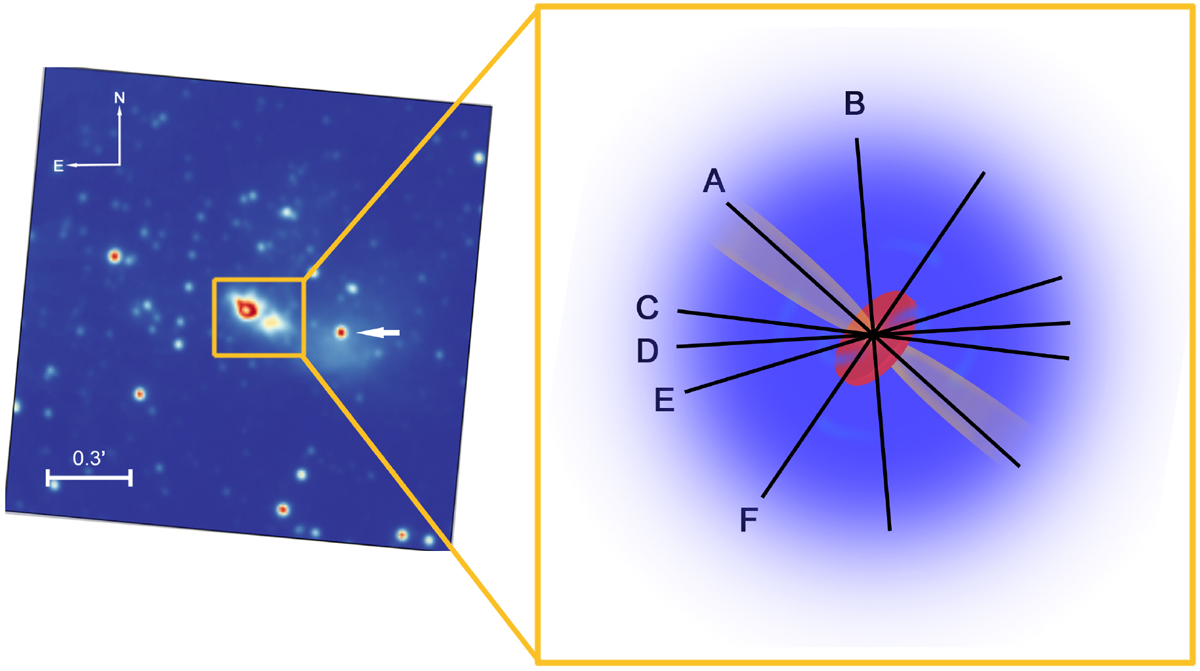
A logarithmically scaled VVV Ks-band image of G305.20+0.21 (left). Two lobes are visible separated by a dark lane. The bright point-source (noted with a white arrow) approximately 0.3′ west of the central object surrounded is a known compact H II region. The Ks-band image is supplemented by a schematic of the suspected MYSO geometry overlain with the projected baselines of each configuration of the MIDI observations (right). In the schematic the envelope is shown in blue, the cavity in yellow and the disk in red.
Current usage metrics show cumulative count of Article Views (full-text article views including HTML views, PDF and ePub downloads, according to the available data) and Abstracts Views on Vision4Press platform.
Data correspond to usage on the plateform after 2015. The current usage metrics is available 48-96 hours after online publication and is updated daily on week days.
Initial download of the metrics may take a while.