Fig. 11.
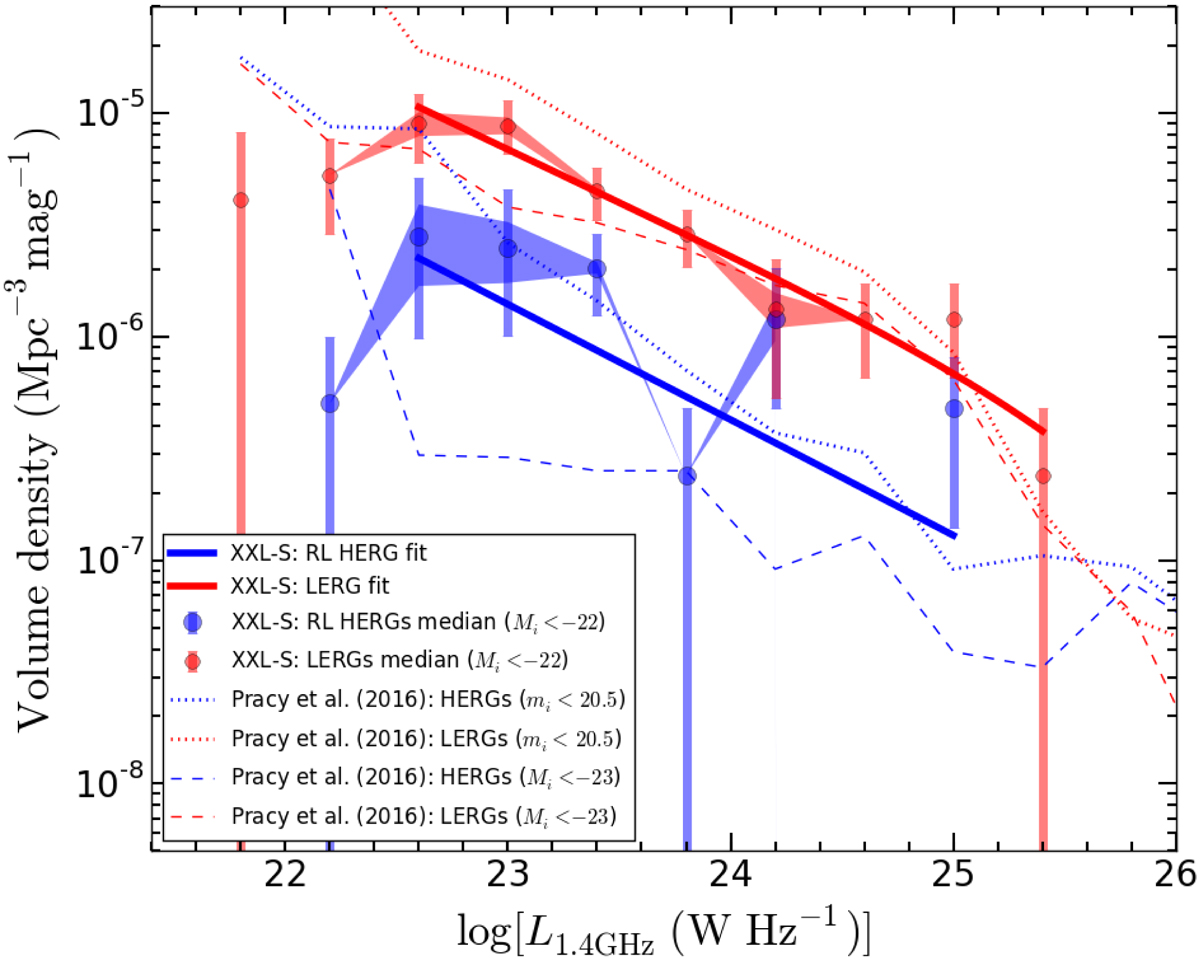
Local (0 < z < 0.3) 1.4 GHz XXL-S RLFs for RL HERGs (blue shaded region) and LERGs (red shaded region) with Mi < −22. The best fit function for the RL HERGs is the solid blue line and the best fit function for the LERGs is the solid red line. The fits exclude the data points with log[L1.4 GHz (W Hz−1)] < 22.6. See Table 13 for the best fit parameters. For comparison, the Pracy16 HERG and LERG RLFs with mi < 20.5 (including all sources) and Mi < −23 are shown.
Current usage metrics show cumulative count of Article Views (full-text article views including HTML views, PDF and ePub downloads, according to the available data) and Abstracts Views on Vision4Press platform.
Data correspond to usage on the plateform after 2015. The current usage metrics is available 48-96 hours after online publication and is updated daily on week days.
Initial download of the metrics may take a while.