Fig. 8.
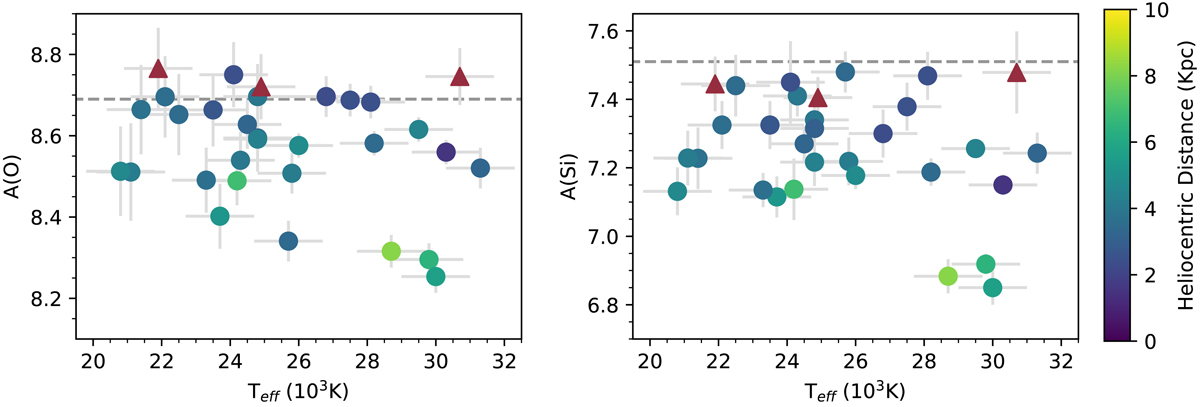
Silicon and oxygen abundances as a function of Teff. Circles represent the stars of the outer disk sample, color-coded by distance; triangles represent the three nearby stars. The dashed lines in both panels represent the solar abundances A(O) = 8.69 and A(Si) = 7.51 (Asplund et al. 2009). A slight, apparent correlation between abundances and Teff is likely connected to the radial gradient.
Current usage metrics show cumulative count of Article Views (full-text article views including HTML views, PDF and ePub downloads, according to the available data) and Abstracts Views on Vision4Press platform.
Data correspond to usage on the plateform after 2015. The current usage metrics is available 48-96 hours after online publication and is updated daily on week days.
Initial download of the metrics may take a while.