Fig. 7.
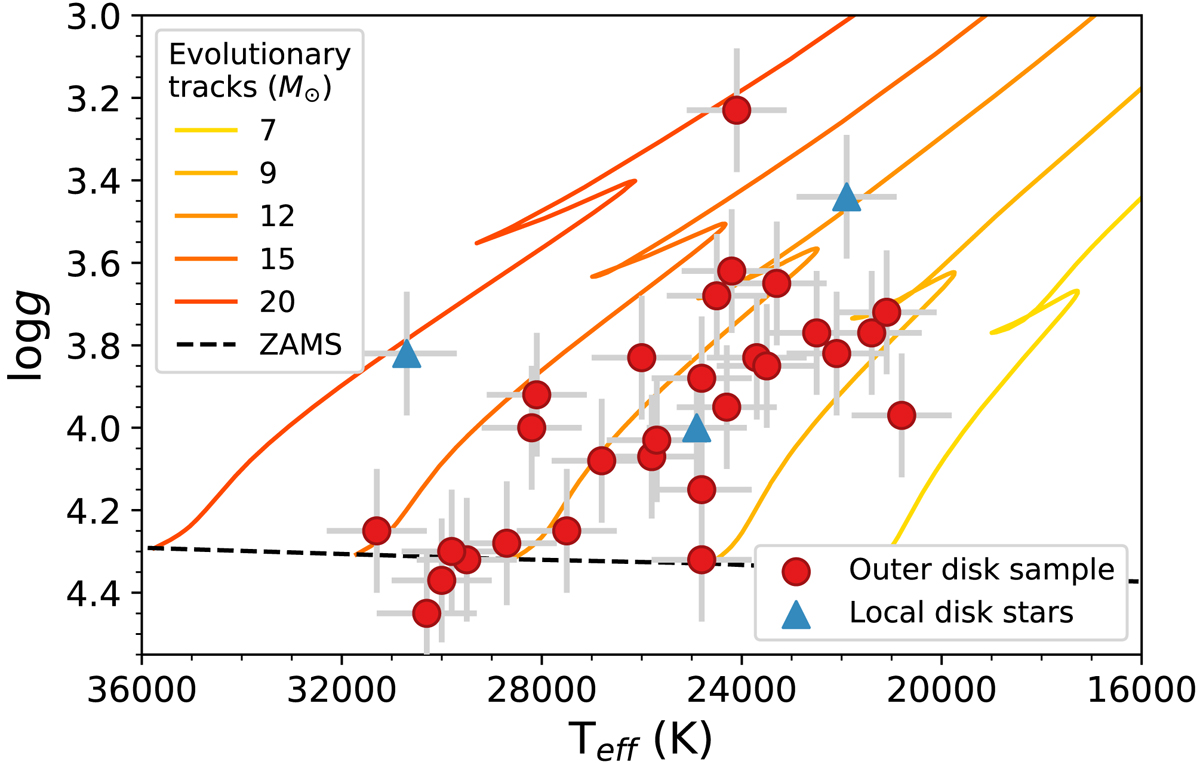
The spectroscopic HR diagram for the sample stars: red circles represent the outer disk stars and the blue triangles represent the Local disk stars. Evolutionary tracks computed for masses 7, 9, 12, 15, and 20 M⊙ (solid lines, from yellow to orange, respectively) and for the Zero Age Main Sequence (ZAMS, dashed line) are also shown (Ekström et al. 2012).
Current usage metrics show cumulative count of Article Views (full-text article views including HTML views, PDF and ePub downloads, according to the available data) and Abstracts Views on Vision4Press platform.
Data correspond to usage on the plateform after 2015. The current usage metrics is available 48-96 hours after online publication and is updated daily on week days.
Initial download of the metrics may take a while.