Fig. 9.
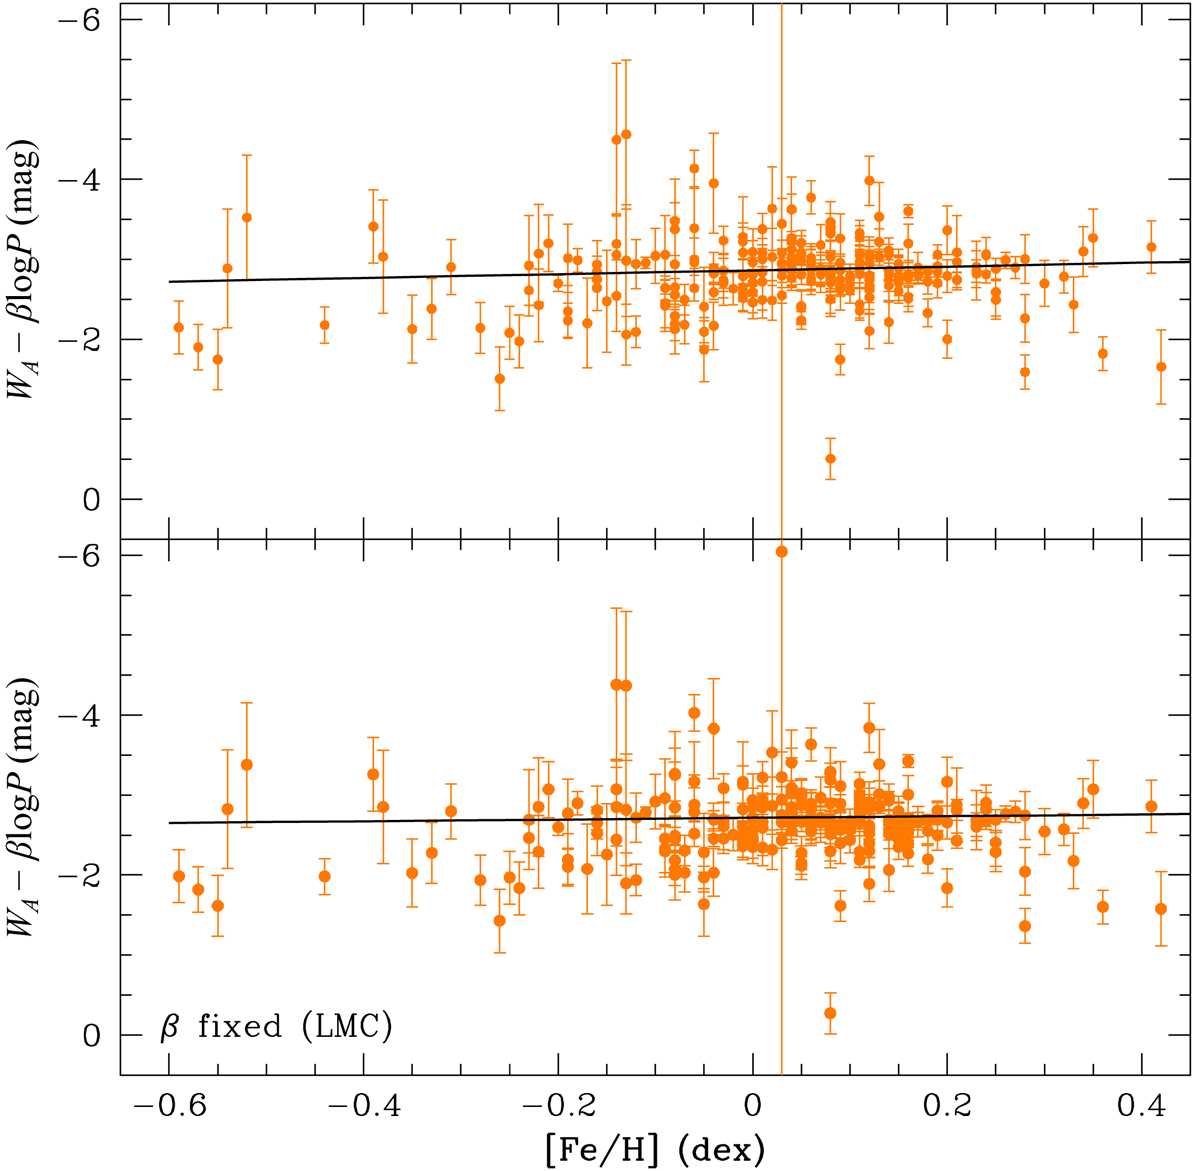
Dependence of the PW relation from [Fe/H]. Orange symbols represent DCEP_F pulsators, whereas the solid lines are the results of the fitting procedure for the ABL formulation of Eq. (11) in two cases: (i) all parameters free to vary (top panel); (ii) β parameter fixed to the value of LMC (bottom panel). The coefficient of the regression lines are shown in the last two lines of Table 3.
Current usage metrics show cumulative count of Article Views (full-text article views including HTML views, PDF and ePub downloads, according to the available data) and Abstracts Views on Vision4Press platform.
Data correspond to usage on the plateform after 2015. The current usage metrics is available 48-96 hours after online publication and is updated daily on week days.
Initial download of the metrics may take a while.