Fig. 8.
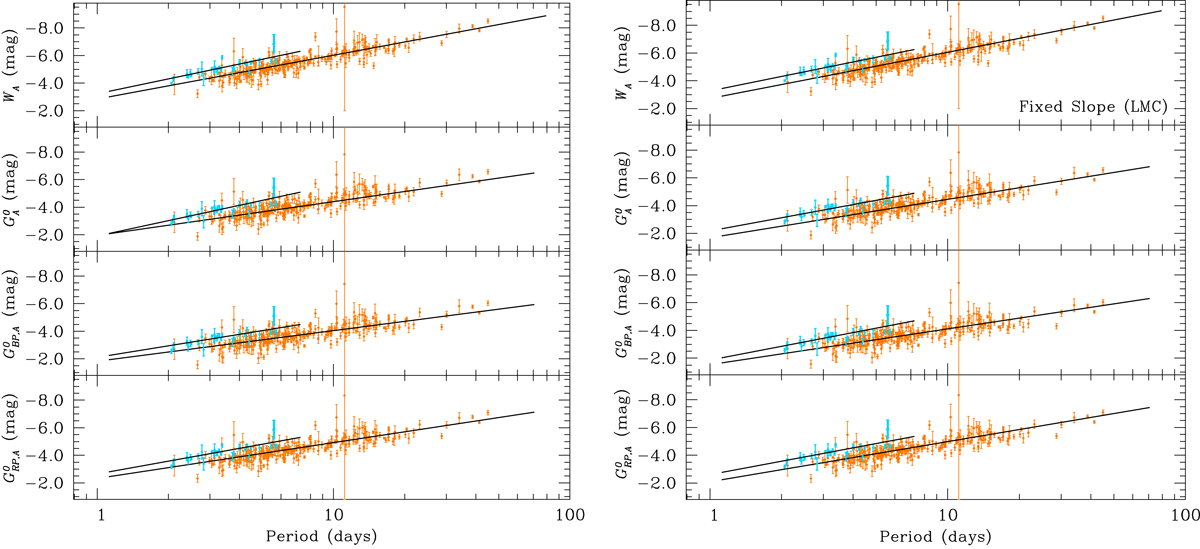
Resulting PL/PW relations for the MW selected sample of DCEPs having reddening estimate and intensity averaged magnitudes in G, GBP and GRP bands coming from the Cepheids&RRLyrae SOS pipeline. Orange and light blue symbols represent DCEP_F and DCEP_1O, respectively. The solid lines are the least-squares fits to the data obtained using the ABL formulation (see text). As in Fig. 3, left and right panels show the relations obtained leaving all the parameters free to vary and fixing the value of β in Eq. (7), respectively. The coefficient of the regression lines are shown in Table 3. An underscript “A” means absolute magnitudes whereas a superscript 0 characterises de-reddened quantities.
Current usage metrics show cumulative count of Article Views (full-text article views including HTML views, PDF and ePub downloads, according to the available data) and Abstracts Views on Vision4Press platform.
Data correspond to usage on the plateform after 2015. The current usage metrics is available 48-96 hours after online publication and is updated daily on week days.
Initial download of the metrics may take a while.