Fig. 3.
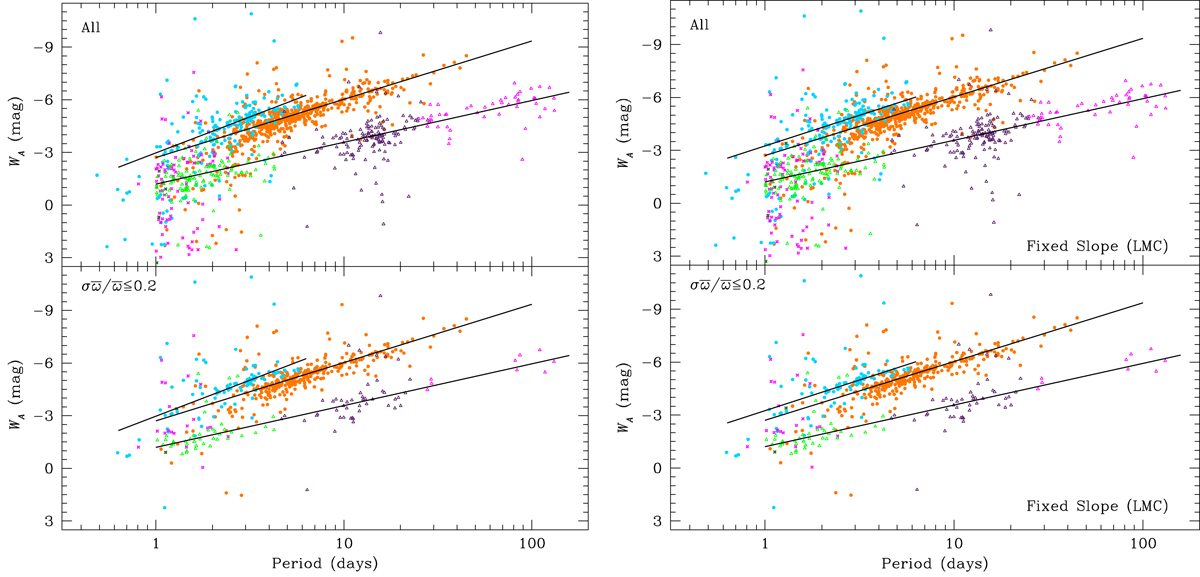
Results for the reclassified MW sample: PW relations. The colour code is as in Fig. 1. Top and bottom panels: complete sample and that with relative error on parallax better than 20%, respectively. The solid lines represent the least-squares fit to the data obtained with the ABL method (see text). The PW relations are of the form WA = α + β log P. Left panels: PW relations obtained with β coefficient treated as unknown parameter in Eq. (7). Right panels: β coefficient fixed and equal to that obtained from the LMC.
Current usage metrics show cumulative count of Article Views (full-text article views including HTML views, PDF and ePub downloads, according to the available data) and Abstracts Views on Vision4Press platform.
Data correspond to usage on the plateform after 2015. The current usage metrics is available 48-96 hours after online publication and is updated daily on week days.
Initial download of the metrics may take a while.