Open Access
Fig. 9.
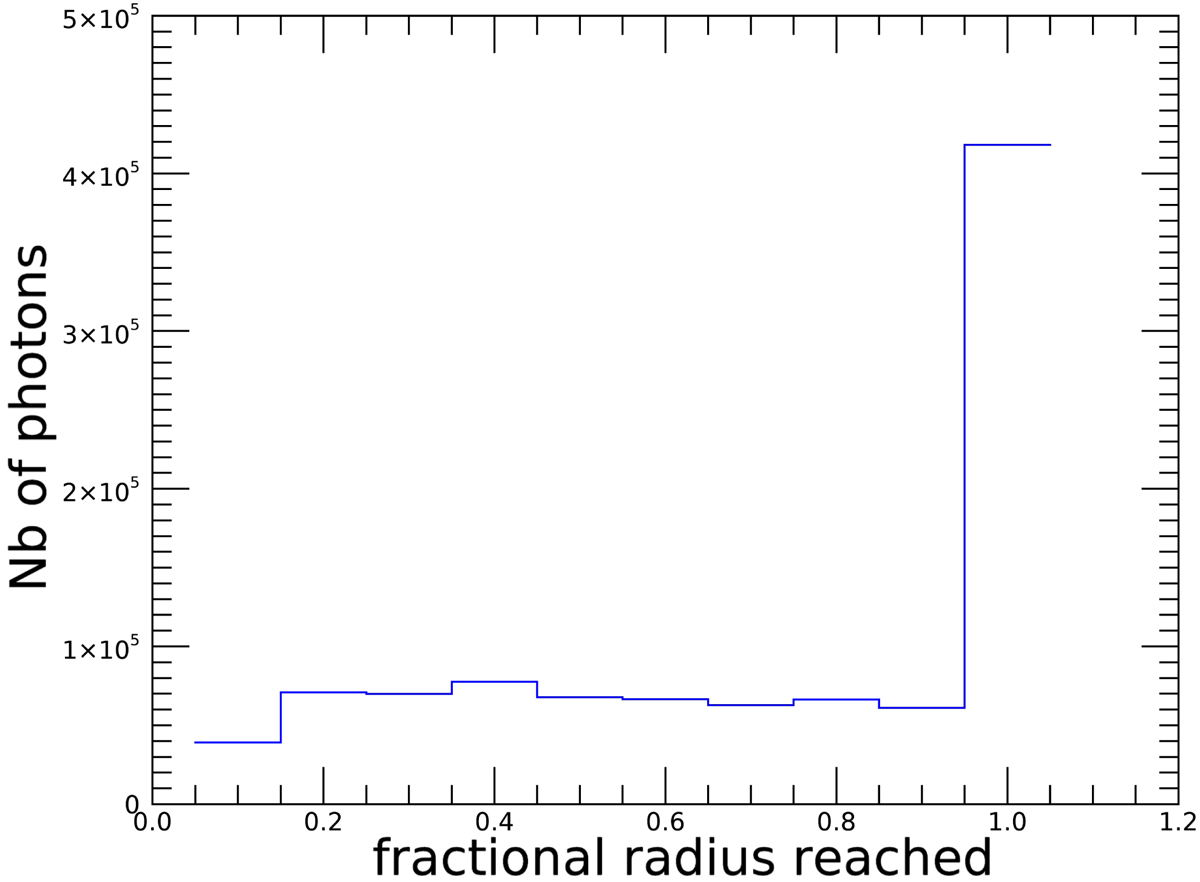
Histogram of the radius reached by photons launched from the centre of a sphere populated by 300 absorbing clouds totalling a filling factor of 2.5%. The last and highest bin corresponds to escaping photons. There is a very flat distribution of radii.
Current usage metrics show cumulative count of Article Views (full-text article views including HTML views, PDF and ePub downloads, according to the available data) and Abstracts Views on Vision4Press platform.
Data correspond to usage on the plateform after 2015. The current usage metrics is available 48-96 hours after online publication and is updated daily on week days.
Initial download of the metrics may take a while.