Fig. 1.
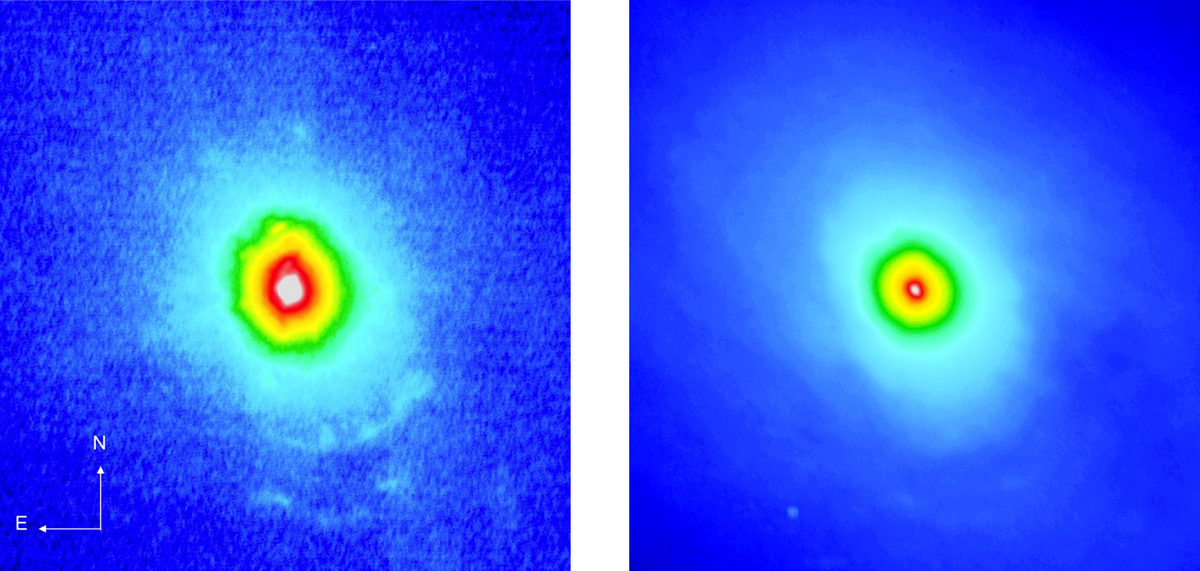
Ks-band (left) and H-band (right) images of the central 438 × 438 pc of NGC 1068, obtained with SPHERE, where 1 arcsec is 70 pc. The intensity scaling corresponds to an Asinh law. For the Ks-band image the flux at peak (white area) is 2.3 × 10⁻³ Jy pixel−1, and in the light blue area it is ≈6.0 × 10⁻⁶ Jy pixel−1. For the H-band image the flux at peak (white) is 2.0 × 10⁻⁴ Jy pixel−1, and in the light blue area it is ≈7.5 × 10⁻⁶ Jy pixel−1.
Current usage metrics show cumulative count of Article Views (full-text article views including HTML views, PDF and ePub downloads, according to the available data) and Abstracts Views on Vision4Press platform.
Data correspond to usage on the plateform after 2015. The current usage metrics is available 48-96 hours after online publication and is updated daily on week days.
Initial download of the metrics may take a while.