Fig. 9.
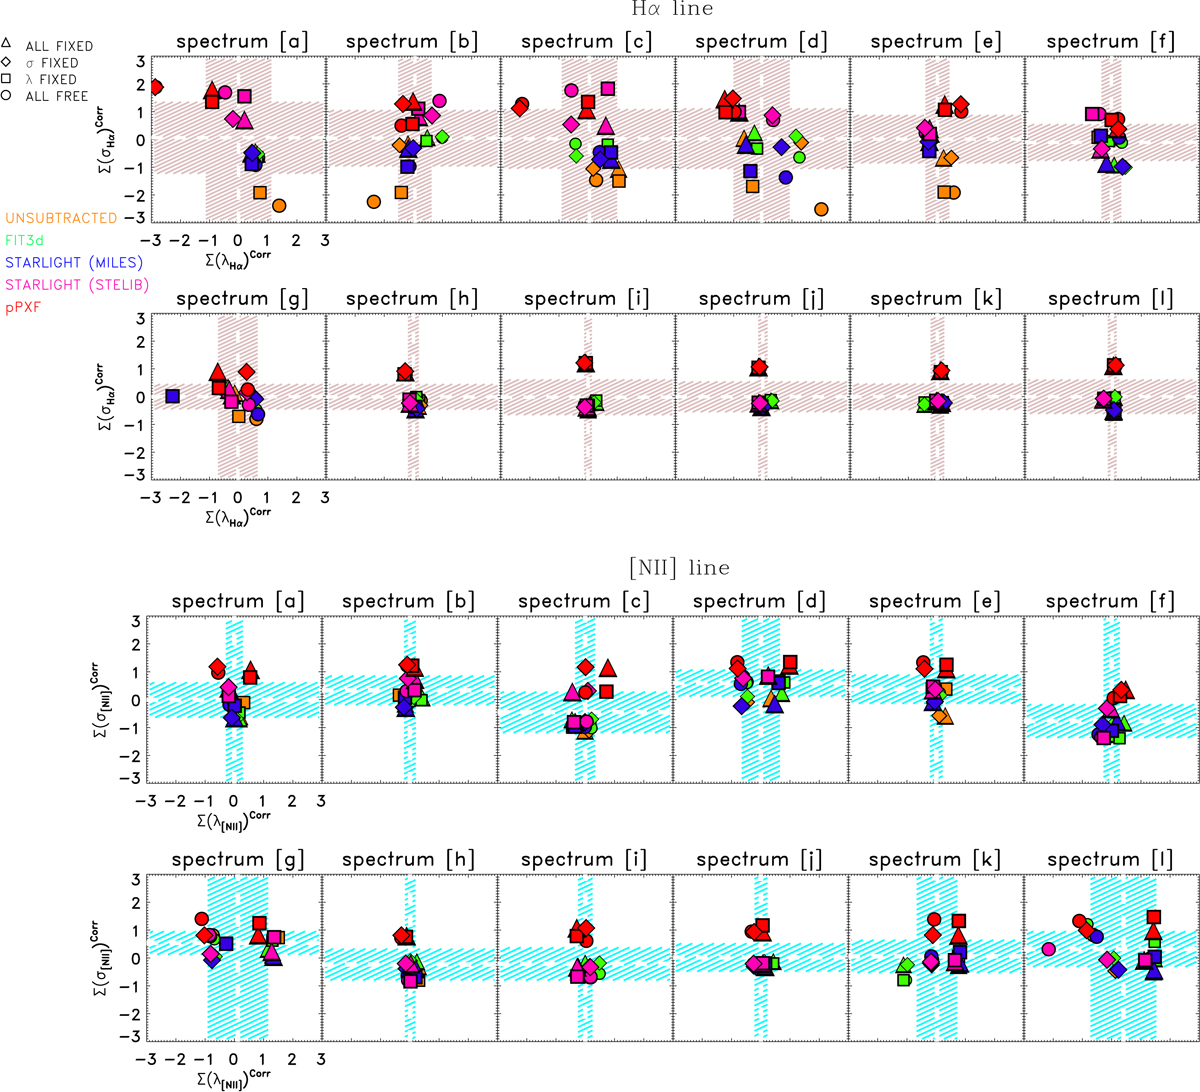
Corrected deviations Σ(λi, mc)i, mc and Σ(σi, mc)Corr for the Hα (top) and [NII] (bottom) lines derived by applying the same mean dispersion factor (![]() Å; see also Fig. 5) for the wavelength and the velocity dispersion. In this correction the dispersion generated from using different stellar-subtraction methods and line-fitting cases is included. The error bars are now ≲1 Å for all spectra and for both parameters (shaded light red and cyan areas for the Hα and [NII] lines, respectively). The mean corrected deviations are represented by dashed white lines for both lines.
Å; see also Fig. 5) for the wavelength and the velocity dispersion. In this correction the dispersion generated from using different stellar-subtraction methods and line-fitting cases is included. The error bars are now ≲1 Å for all spectra and for both parameters (shaded light red and cyan areas for the Hα and [NII] lines, respectively). The mean corrected deviations are represented by dashed white lines for both lines.
Current usage metrics show cumulative count of Article Views (full-text article views including HTML views, PDF and ePub downloads, according to the available data) and Abstracts Views on Vision4Press platform.
Data correspond to usage on the plateform after 2015. The current usage metrics is available 48-96 hours after online publication and is updated daily on week days.
Initial download of the metrics may take a while.