Fig. 8.
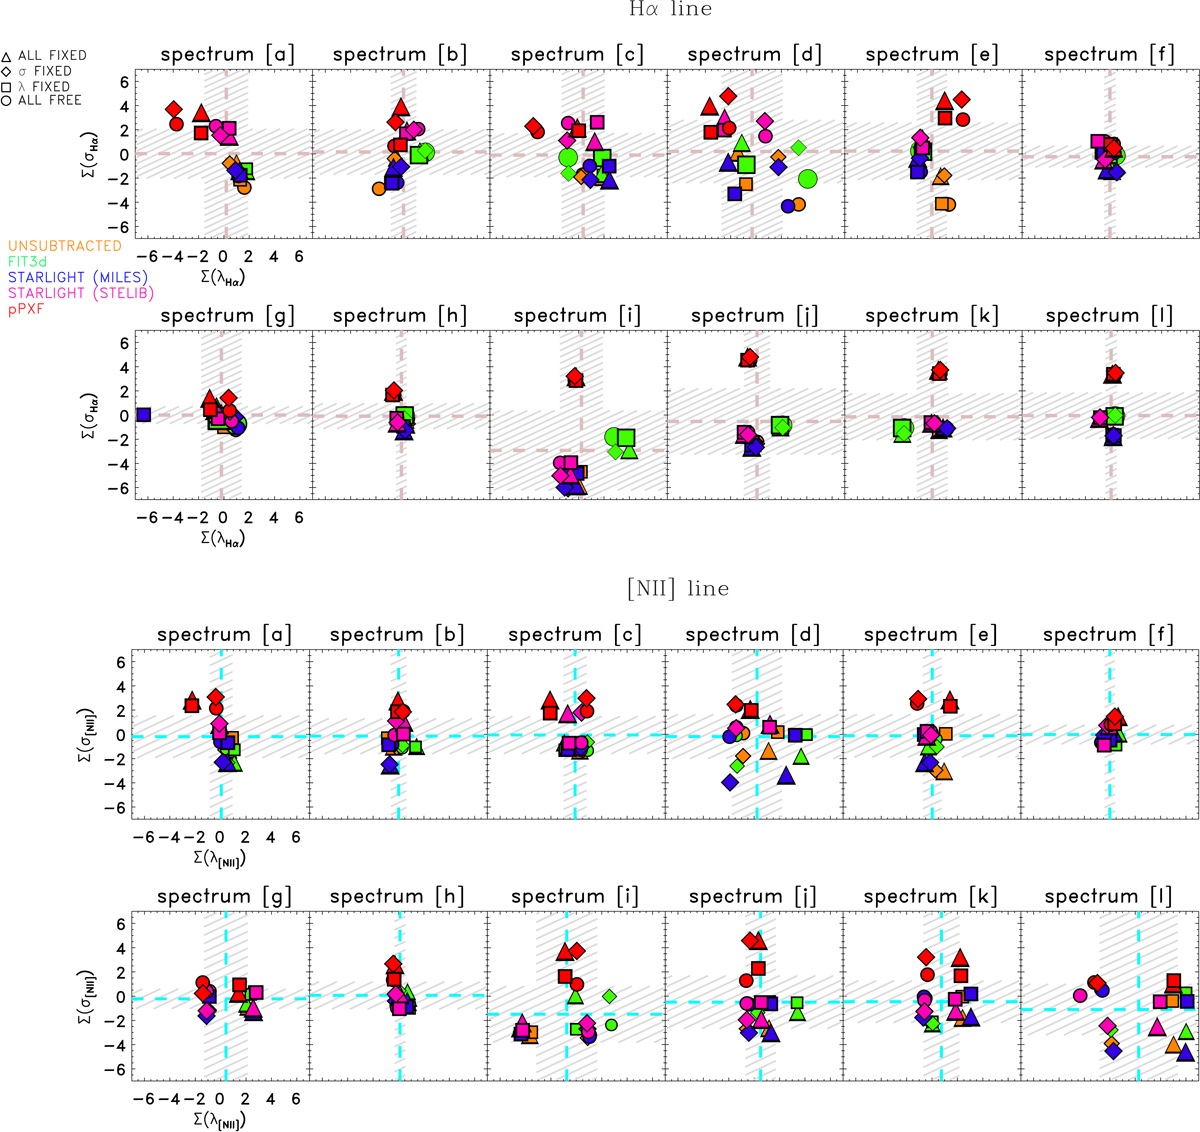
Kinematic parameter deviations, Σ(λi, mc) and Σ(σi, mc) computed with respect to their mean values and normalized to the line-fitting errors derived using IDL for each individual spectrum. The mean deviations as well as their standard deviations are represented using dashed lines (light red for the Hα and cyan for the [NII] lines) and the shaded area in gray, respectively. Top panels: Hα results. Bottom panels: [NII] results.
Current usage metrics show cumulative count of Article Views (full-text article views including HTML views, PDF and ePub downloads, according to the available data) and Abstracts Views on Vision4Press platform.
Data correspond to usage on the plateform after 2015. The current usage metrics is available 48-96 hours after online publication and is updated daily on week days.
Initial download of the metrics may take a while.