Fig. 4.
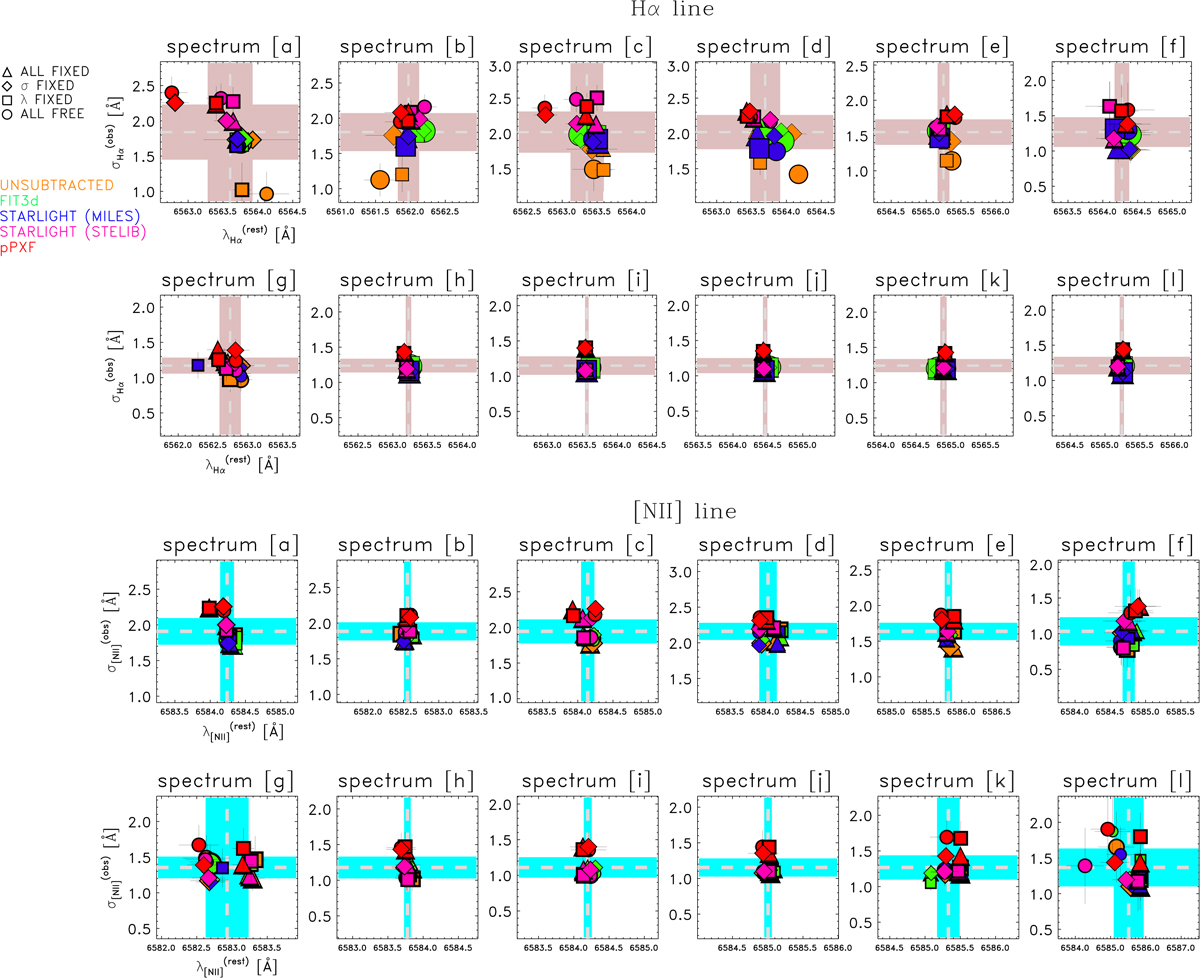
Kinematic results for the individual spectra when using different stellar-subtraction methods and line-fitting approaches for the Hα (top) and [NII] (bottom) emission lines. The four line-fitting cases and the five stellar-subtraction methods used are highlighted according to the different symbols and colors (as in Fig. 2), respectively (twenty values for each spectrum). The mean wavelength and dispersion (![]() ,
, ![]() ) as well as their standard deviation (
) as well as their standard deviation (![]() ,
, ![]() ) are represented using dashed light gray lines and the shaded area (light red and cyan), respectively.
) are represented using dashed light gray lines and the shaded area (light red and cyan), respectively.
Current usage metrics show cumulative count of Article Views (full-text article views including HTML views, PDF and ePub downloads, according to the available data) and Abstracts Views on Vision4Press platform.
Data correspond to usage on the plateform after 2015. The current usage metrics is available 48-96 hours after online publication and is updated daily on week days.
Initial download of the metrics may take a while.