Free Access
Fig. B.2.
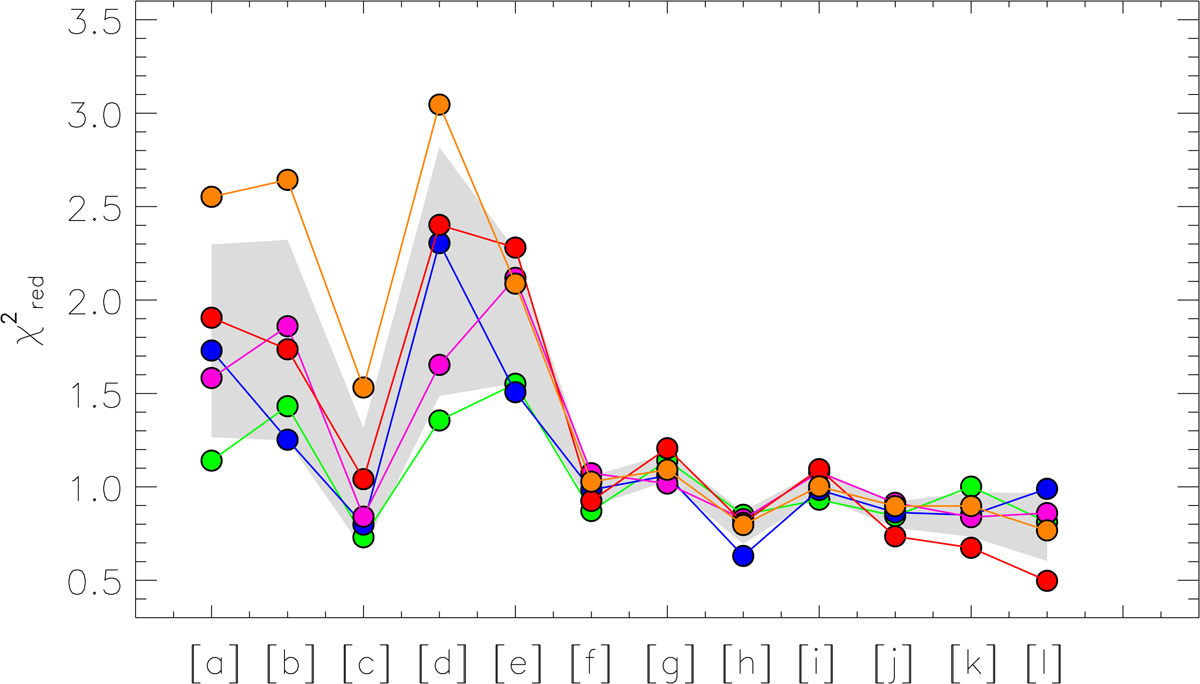
Reduced chi-square distribution for each individual spaxel as derived when applying the five stellar-subtraction methods (color-coded as in Fig. B.1). The gray area represents the range of values covered by the mean chi-square within the respective standard deviation derived for each ith spaxel ( ![]() ).
).
Current usage metrics show cumulative count of Article Views (full-text article views including HTML views, PDF and ePub downloads, according to the available data) and Abstracts Views on Vision4Press platform.
Data correspond to usage on the plateform after 2015. The current usage metrics is available 48-96 hours after online publication and is updated daily on week days.
Initial download of the metrics may take a while.