Fig. A.1.
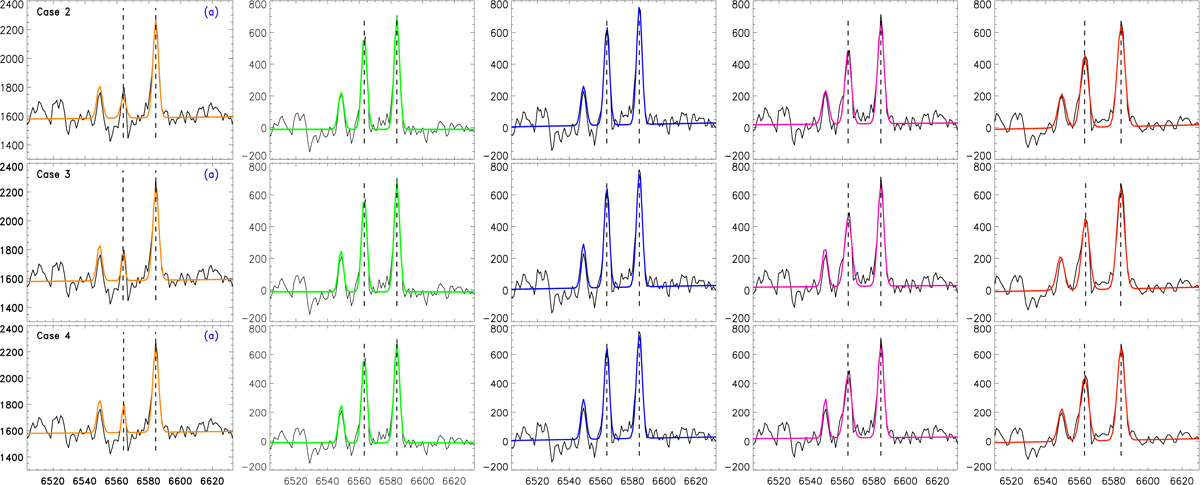
(General comments about the panels as in Fig. 2) Line-fitting results for the spectrum “a” obtained following the assumptions of case 2 [λ free, σ fixed] (top), case 3 [λ fixed, σ free] (middle), and case 4 [λ and σ free] (bottom). For each case and method the centroid of the Hα and [NII] lines is highlighted using the dashed lines. The line-fitting results are shown using the colored solid line: the “unsubtracted” data are in orange, FIT3D data in green, STARLIGHT (MILES) data in dark blue, STARLIGHT (STELIB) data in magenta and pPXF data in red.
Current usage metrics show cumulative count of Article Views (full-text article views including HTML views, PDF and ePub downloads, according to the available data) and Abstracts Views on Vision4Press platform.
Data correspond to usage on the plateform after 2015. The current usage metrics is available 48-96 hours after online publication and is updated daily on week days.
Initial download of the metrics may take a while.