Fig. 1.
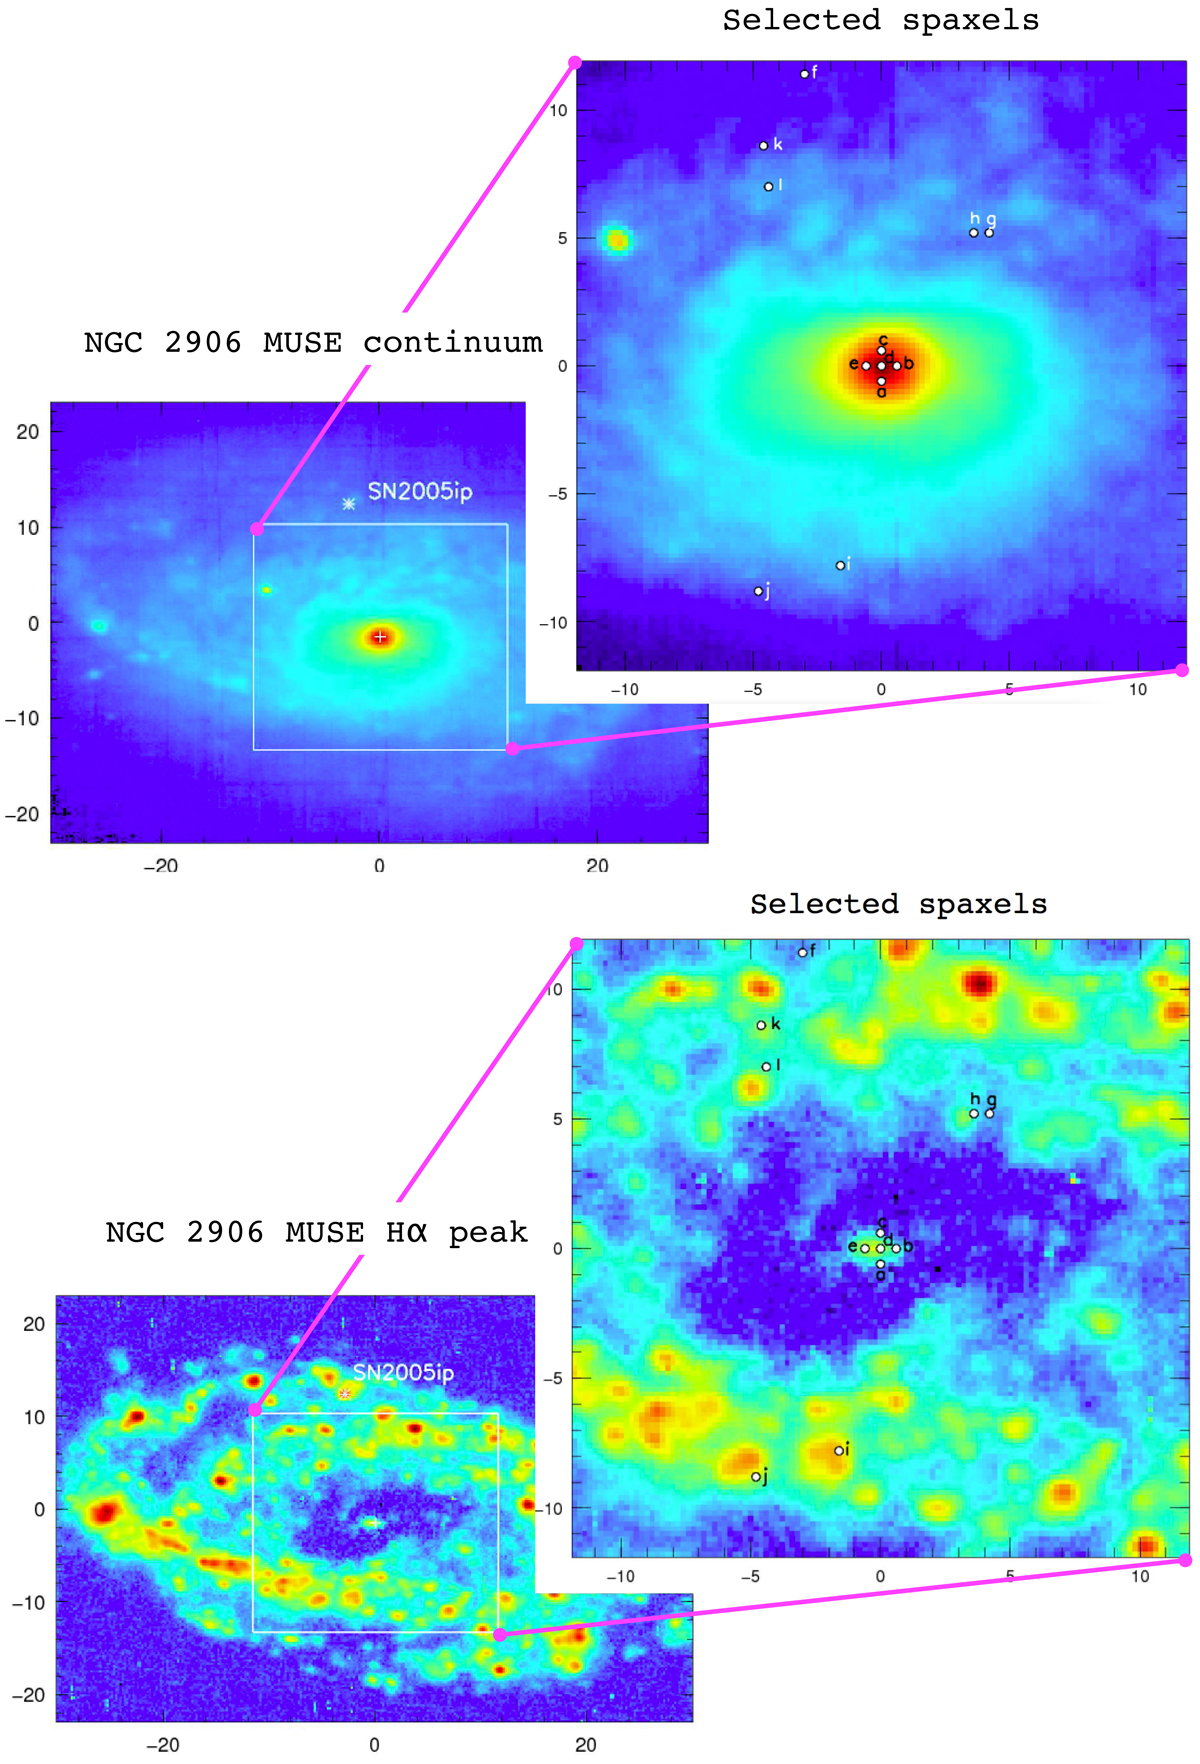
Top panel: continuum MUSE image of NGC 2906. The continuum image was obtained as the mean of the median values in two wavelength ranges: 5620–5750 Å and 6890–7000 Å. Left panel: nuclear peak shown by a cross symbol and the position of the supernova SN2005ip represented by the star symbol. A zoom of the region selected by the white box is shown on the right. Right panel: region showing the distribution of the spectra (white dots) which have been chosen for the analysis. Each spectrum is identified by a letter (a, b, ..., k, l) in order to allow the reader to easily find its position. Bottom panel: Hα peak emission of the same regions as described in the top figure.
Current usage metrics show cumulative count of Article Views (full-text article views including HTML views, PDF and ePub downloads, according to the available data) and Abstracts Views on Vision4Press platform.
Data correspond to usage on the plateform after 2015. The current usage metrics is available 48-96 hours after online publication and is updated daily on week days.
Initial download of the metrics may take a while.