Fig. A.1
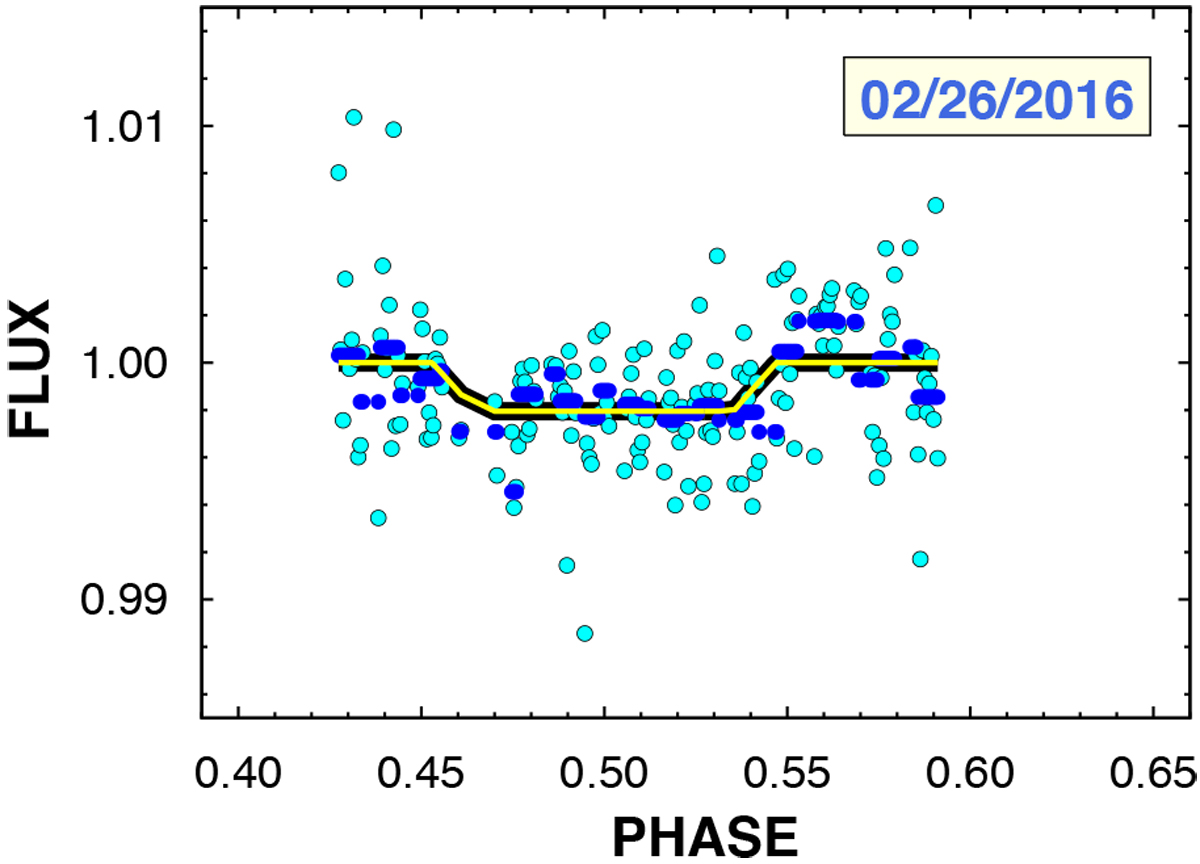
Separate trapezoidal eclipse fit to the systematics-filtered secondary eclipse light curve observed on 2016 February 26. The flux ratio is normalized to 1.0 in the OOE part of the light curve. The best-fitting trapezoidal is shown by the yellow line (with a black silhouette for better visibility). The 30-bin averages of the light-curve points are shown by the blue dashes.
Current usage metrics show cumulative count of Article Views (full-text article views including HTML views, PDF and ePub downloads, according to the available data) and Abstracts Views on Vision4Press platform.
Data correspond to usage on the plateform after 2015. The current usage metrics is available 48-96 hours after online publication and is updated daily on week days.
Initial download of the metrics may take a while.