Fig. 7
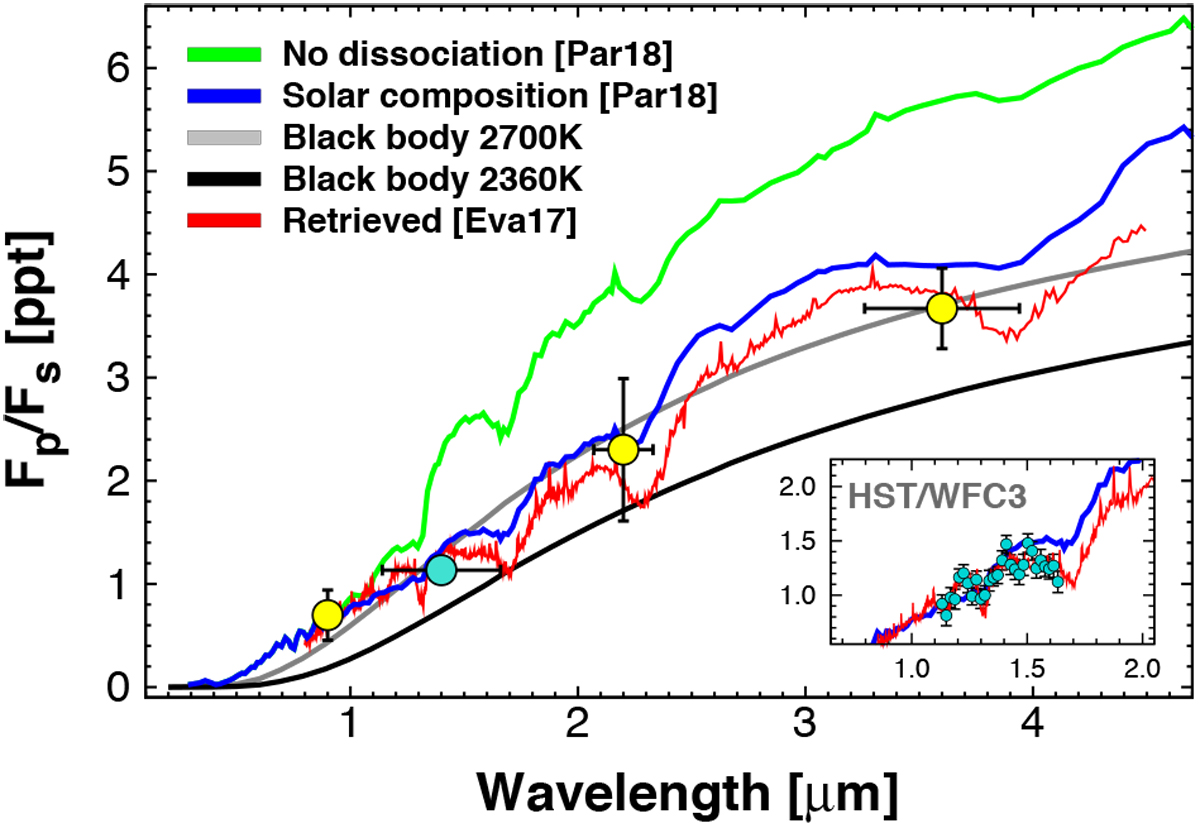
Comparison of the single-band secondary eclipse depths (including the band-averaged HST/WFC3 data, turquoise dot) with the planetary atmosphere models of Parmentier et al. (2018) [Par18] and Evans et al. (2017) [Eva17]. Vertical error bars show 3σ statistical uncertainties, and horizontal bars indicate the widths of the individual wavebands. We caution that the “No dissociation” model is unphysical, and is shown merely to highlight the effect of omitting dissociation in computing the spectrum (see text for further details). The blackbody lines correspond to different efficiency of the day and night heat transport (black: fully efficient; gray: no heat transport). For completeness, the inset shows the HST observations of Evans et al. (2017) with their spectrum retrieval model and the solar composition model of [Par18]. For better visibility, we use 1σ error bars here.
Current usage metrics show cumulative count of Article Views (full-text article views including HTML views, PDF and ePub downloads, according to the available data) and Abstracts Views on Vision4Press platform.
Data correspond to usage on the plateform after 2015. The current usage metrics is available 48-96 hours after online publication and is updated daily on week days.
Initial download of the metrics may take a while.