Fig. 4
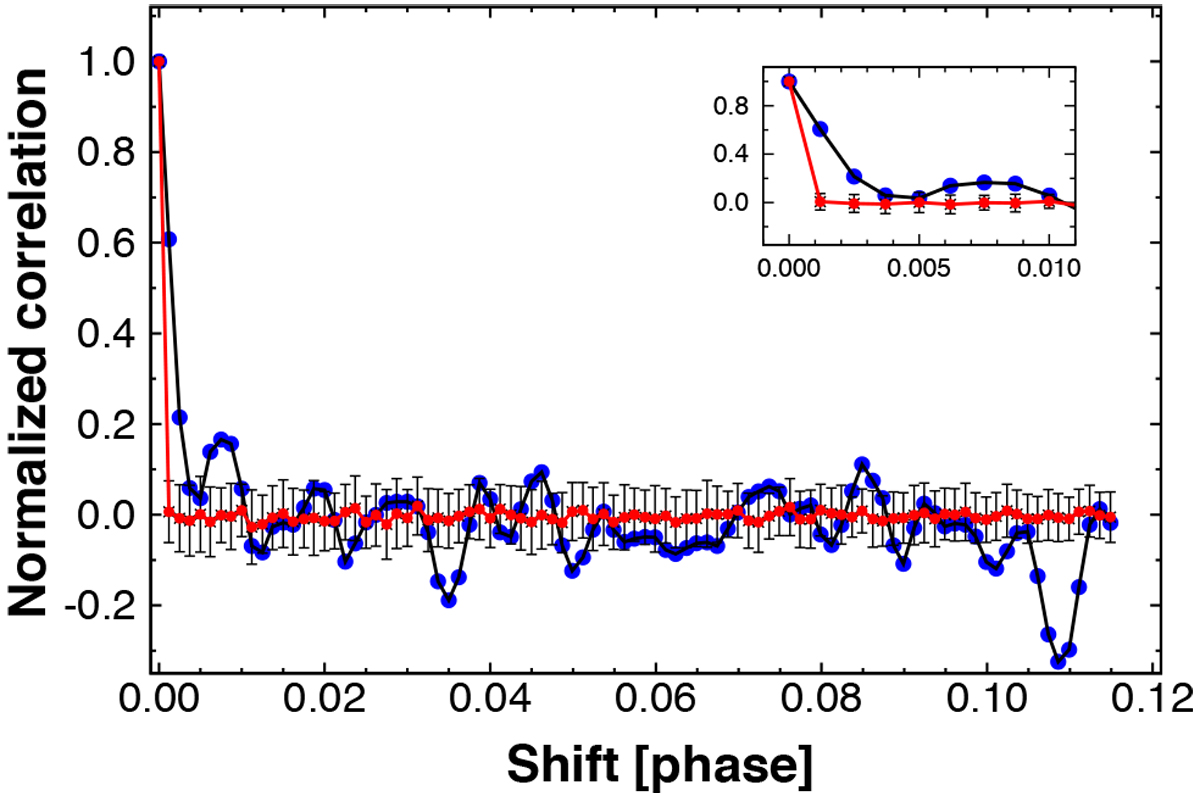
Blue dots: autocorrelation function (ACF) of the residuals of the trapezoidal fit to the final dataset shown in Fig. 3. Red dots: ACF of generated uncorrelated noise. Error bars are for the standard deviations of the ACF values of the random datasets. The time lag is given in units of the orbital period. The inset shows the immediate neighborhood of ACF at zero time-shift.
Current usage metrics show cumulative count of Article Views (full-text article views including HTML views, PDF and ePub downloads, according to the available data) and Abstracts Views on Vision4Press platform.
Data correspond to usage on the plateform after 2015. The current usage metrics is available 48-96 hours after online publication and is updated daily on week days.
Initial download of the metrics may take a while.