Free Access
Fig. 3
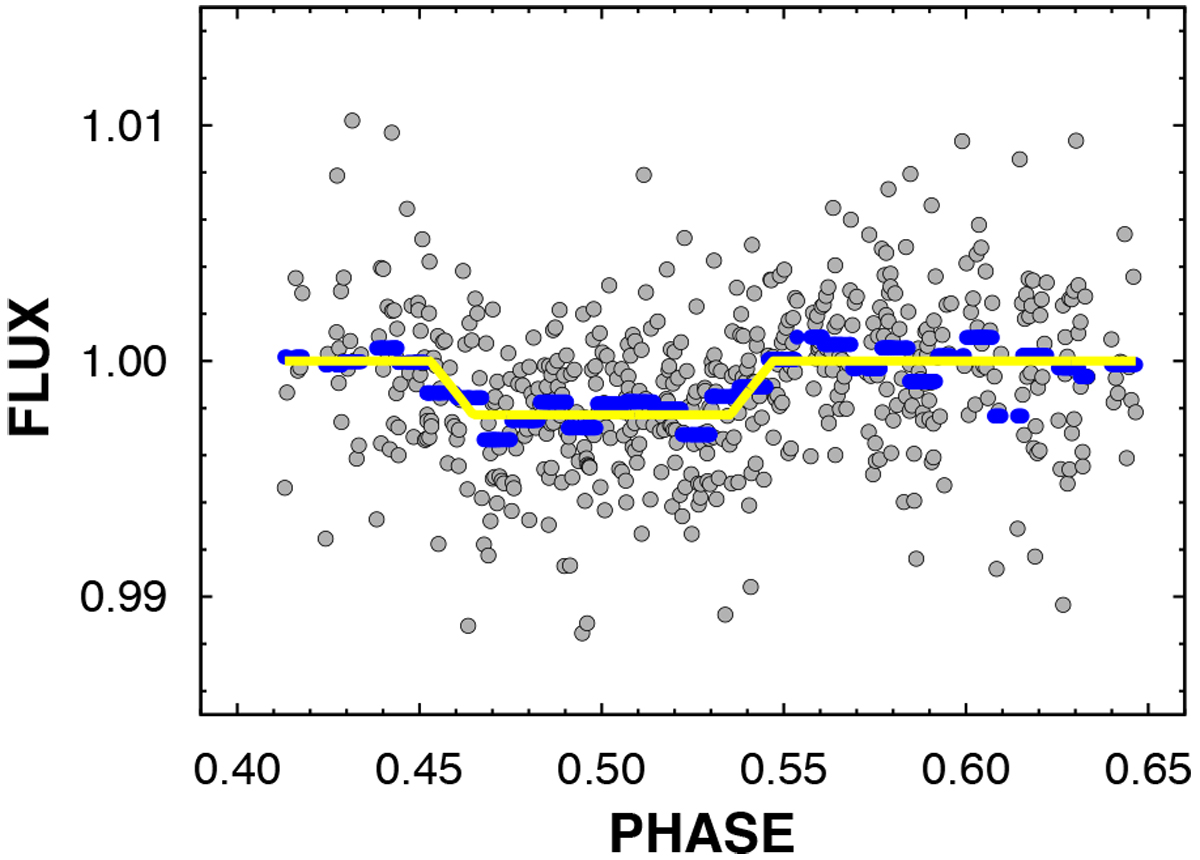
Systematics-filtered folded flux ratios normalized to 1.0 in the OOE part. Average fluxes (in 30 phase bins) are shown by blue dashes, and the best-fitting trapezoidal secondary eclipse approximation is plotted as the yellow continuous line.
Current usage metrics show cumulative count of Article Views (full-text article views including HTML views, PDF and ePub downloads, according to the available data) and Abstracts Views on Vision4Press platform.
Data correspond to usage on the plateform after 2015. The current usage metrics is available 48-96 hours after online publication and is updated daily on week days.
Initial download of the metrics may take a while.