Free Access
Fig. 2
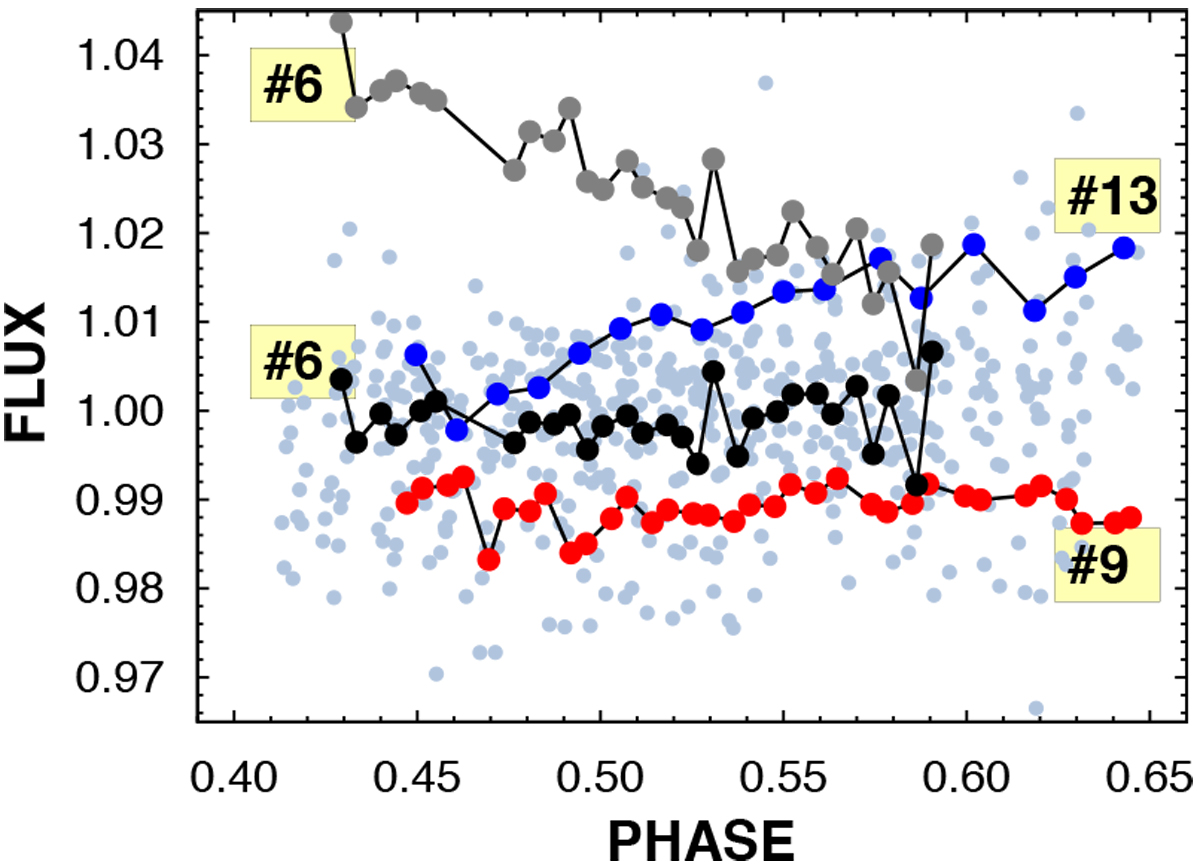
Simple photometric flux ratios ordered by the orbital period (pale dots). Some dithers are annotated to show the nightly trends (or the lack of them, i.e., number 9). Dither 6 (gray dots) is plotted also after employing zero-point shift and detrending by the position vector (black dots, see Sect. 2 for details).
Current usage metrics show cumulative count of Article Views (full-text article views including HTML views, PDF and ePub downloads, according to the available data) and Abstracts Views on Vision4Press platform.
Data correspond to usage on the plateform after 2015. The current usage metrics is available 48-96 hours after online publication and is updated daily on week days.
Initial download of the metrics may take a while.