Fig. 3.
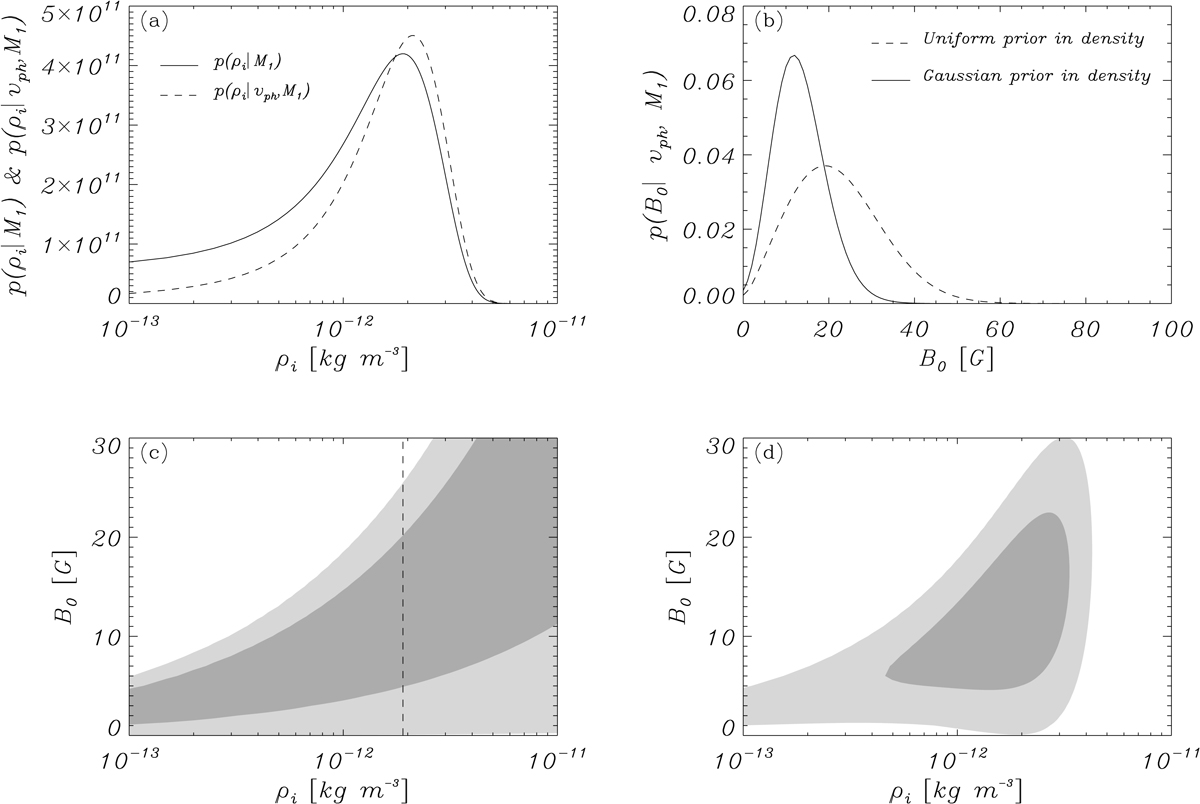
(a): prior and posterior distributions for the waveguide density in the inversion of Eq. (9) with vph = 1030 ± 410 km s−1, under model M1. (b): comparison between the marginal posteriors for magnetic field strength in the same inversion for the cases of uniform and Gaussian prior on the waveguide density. (c) and (d): comparison between the joint two-dimensional posterior distributions for the internal density of the waveguide and the magnetic field strength obtained for the inference with vph = 1030 ± 410 km s−1, under model M1, for the cases of uniform priors (c) and a Gaussian prior for the internal density with μρi = 1.9 × 10⁻¹² kg m−3 and σρi = 0.5μρi (d). The inference with the more informative prior on density leads to ![]() G and
G and ![]() kg m−3. Bottom panels: the outer boundaries of the light grey and dark grey shaded regions indicate the 95% and 68% credible regions.
kg m−3. Bottom panels: the outer boundaries of the light grey and dark grey shaded regions indicate the 95% and 68% credible regions.
Current usage metrics show cumulative count of Article Views (full-text article views including HTML views, PDF and ePub downloads, according to the available data) and Abstracts Views on Vision4Press platform.
Data correspond to usage on the plateform after 2015. The current usage metrics is available 48-96 hours after online publication and is updated daily on week days.
Initial download of the metrics may take a while.