Fig. 2.
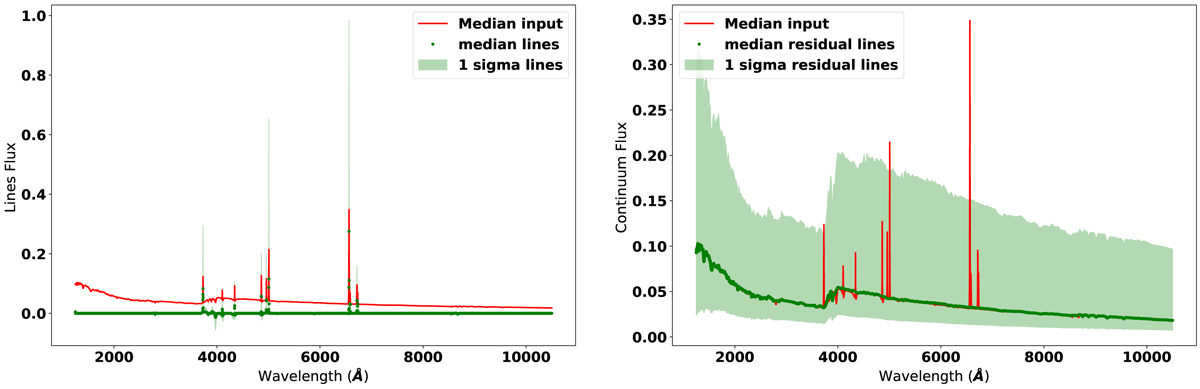
Statistics on extracted line (left) and continuum (right) features. The input median signal in the original training set is displayed, along with the median and standard deviation computed over the line (left) and continuum (right) training data sets. In the first case, the emission lines are well extracted, with signal variability only in regions of emission or absorption lines and without offset due to continuum leakage into line estimation. In the second case, the continuum does not display either discontinuities or acute signal variability in regions of strong emission or absorption lines.
Current usage metrics show cumulative count of Article Views (full-text article views including HTML views, PDF and ePub downloads, according to the available data) and Abstracts Views on Vision4Press platform.
Data correspond to usage on the plateform after 2015. The current usage metrics is available 48-96 hours after online publication and is updated daily on week days.
Initial download of the metrics may take a while.