Fig. 10.
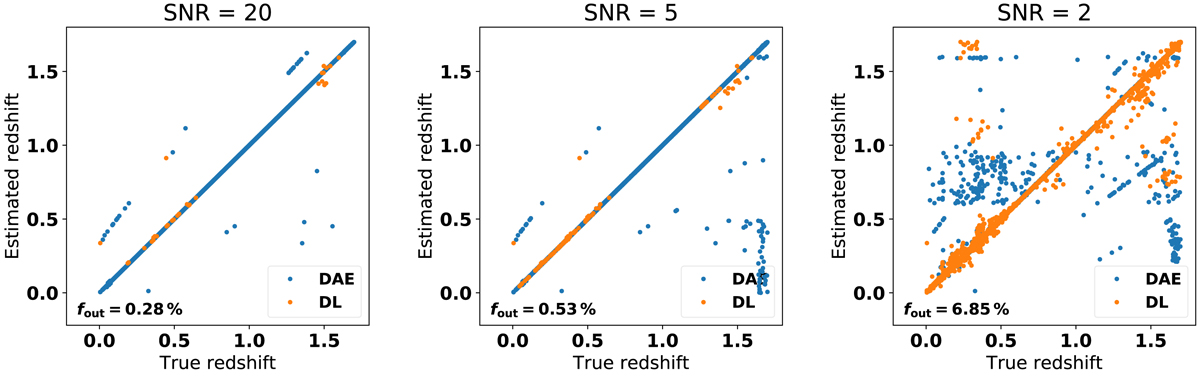
Best estimated redshift versus true redshift for three S/N cases. Blue and orange dots indicate that the redshift was chosen from the DAE and DL method, respectively. In the higher S/N cases, most estimated redshifts come from the DAE method, due to its almost perfect accuracy. At lower S/N values, where the method often starts failing, our algorithm increases the proportion of DL values, which are more robust but with higher variance.
Current usage metrics show cumulative count of Article Views (full-text article views including HTML views, PDF and ePub downloads, according to the available data) and Abstracts Views on Vision4Press platform.
Data correspond to usage on the plateform after 2015. The current usage metrics is available 48-96 hours after online publication and is updated daily on week days.
Initial download of the metrics may take a while.