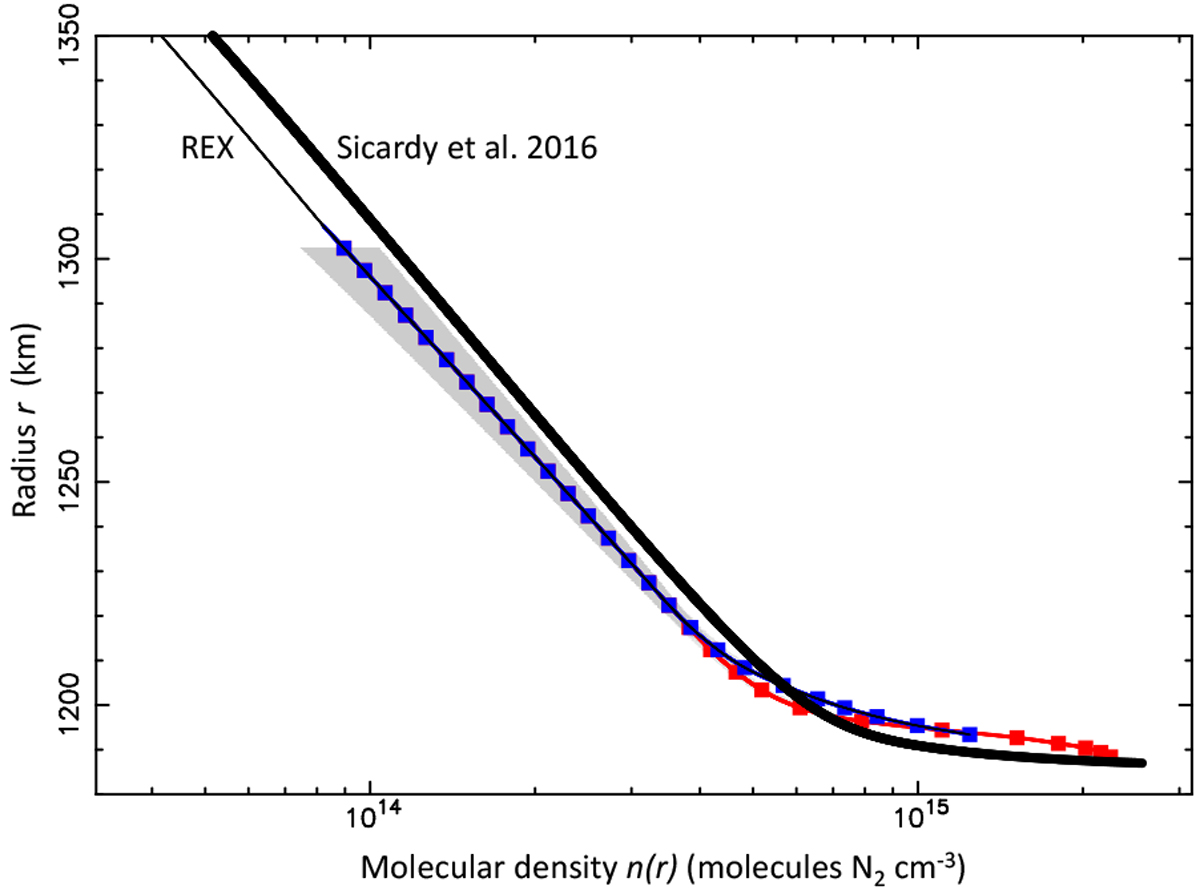
Fig. 7

Red and blue squares: the REX radio occultation N2 density profiles, with the shaded area indicating the 1-σ error bar domain (Hinson et al. 2017). Below 1220 km, the errors decrease and become unnoticeable in this plot. The entry (resp. exit) profile is given from r = 1188.4 km (resp. 1193.4 km), up to 1302.4 km, where the error bars become too large for a reliable profile to be retrieved. We note that by construction, the REX entry and exit profiles are identical for r > 1220 km. Below that radius, the two profiles diverge significantly, due to different physical conditions of the boundary layer just above the surface (Fig. 8). The solid red and blue lines connecting the squares are spline interpolations of the REX profiles that are used in our ray-tracing code; see text. The REX profile is extended above r = 1302.4 km as a thin solid line, by adopting a scaled version of the 2015 June 29 profile (i.e., a mere translation of the thick solid line in this (log10(n), r) plot), while ensuring continuity with the REX profile. Thick solid line: the profile derived by Sicardy et al. (2016) using the DO15 light-curve-fitting model. The formal 1-σ error bar of this profile is smaller than the thickness of the line, but does not account for possible biases; see text.
Current usage metrics show cumulative count of Article Views (full-text article views including HTML views, PDF and ePub downloads, according to the available data) and Abstracts Views on Vision4Press platform.
Data correspond to usage on the plateform after 2015. The current usage metrics is available 48-96 hours after online publication and is updated daily on week days.
Initial download of the metrics may take a while.


