Fig. 4
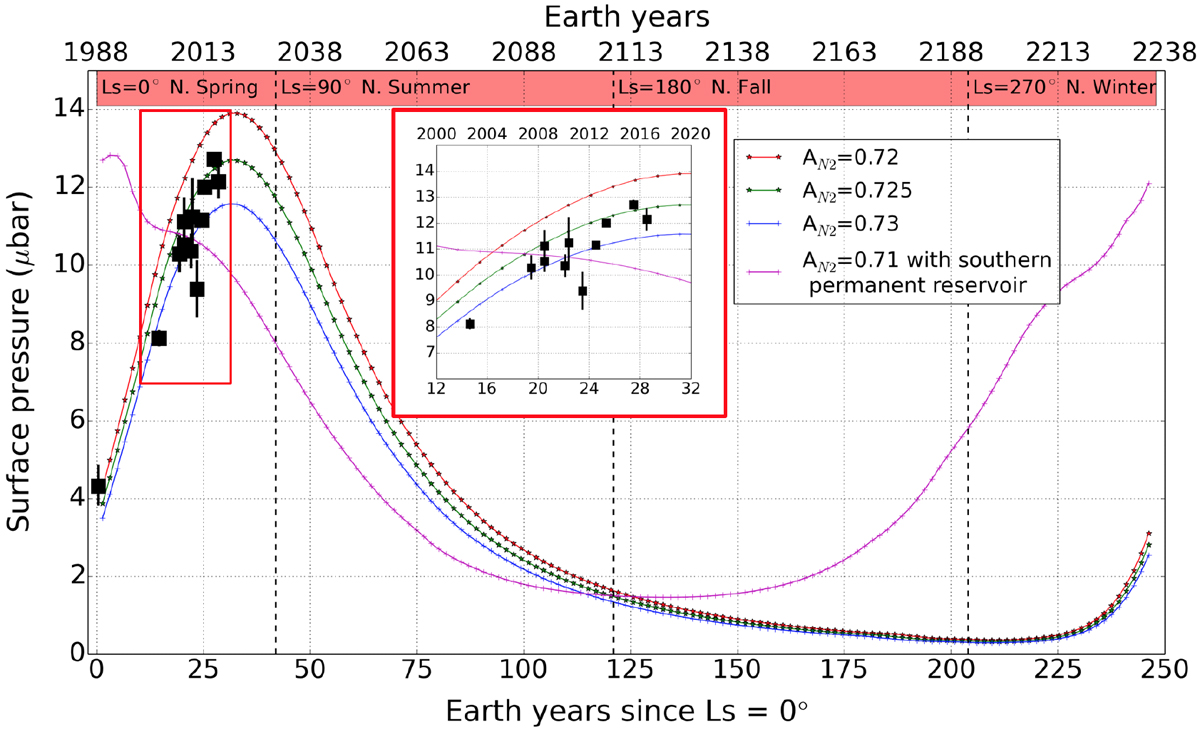
Typical modeled annual evolution of surface pressure obtained with LMD Pluto volatile transport model, assuming permanent deposits of N2 ice inside Sputnik Planitia and in the depression of mid-northern latitudes, a uniform soil seasonal thermal inertia of 800 J s−1∕2 m−2 K−1, an emissivity ɛN2 = 0.8 and albedo range AN2 = 0.72–0.73 for N2 ice, chosen to yield a surface pressure near 10–11 μbar in July 2015. The black dots with error bars show the surface pressure (psurf) inferred from stellar occultation pressure measurements (see Table 2). The curve in magenta corresponds to a similar simulation but assuming a permanent N2 ice reservoir in the south hemisphere between 52.5 and 67.5° S, which leads to a pressure peak in 1990.
Current usage metrics show cumulative count of Article Views (full-text article views including HTML views, PDF and ePub downloads, according to the available data) and Abstracts Views on Vision4Press platform.
Data correspond to usage on the plateform after 2015. The current usage metrics is available 48-96 hours after online publication and is updated daily on week days.
Initial download of the metrics may take a while.