Fig. B.1
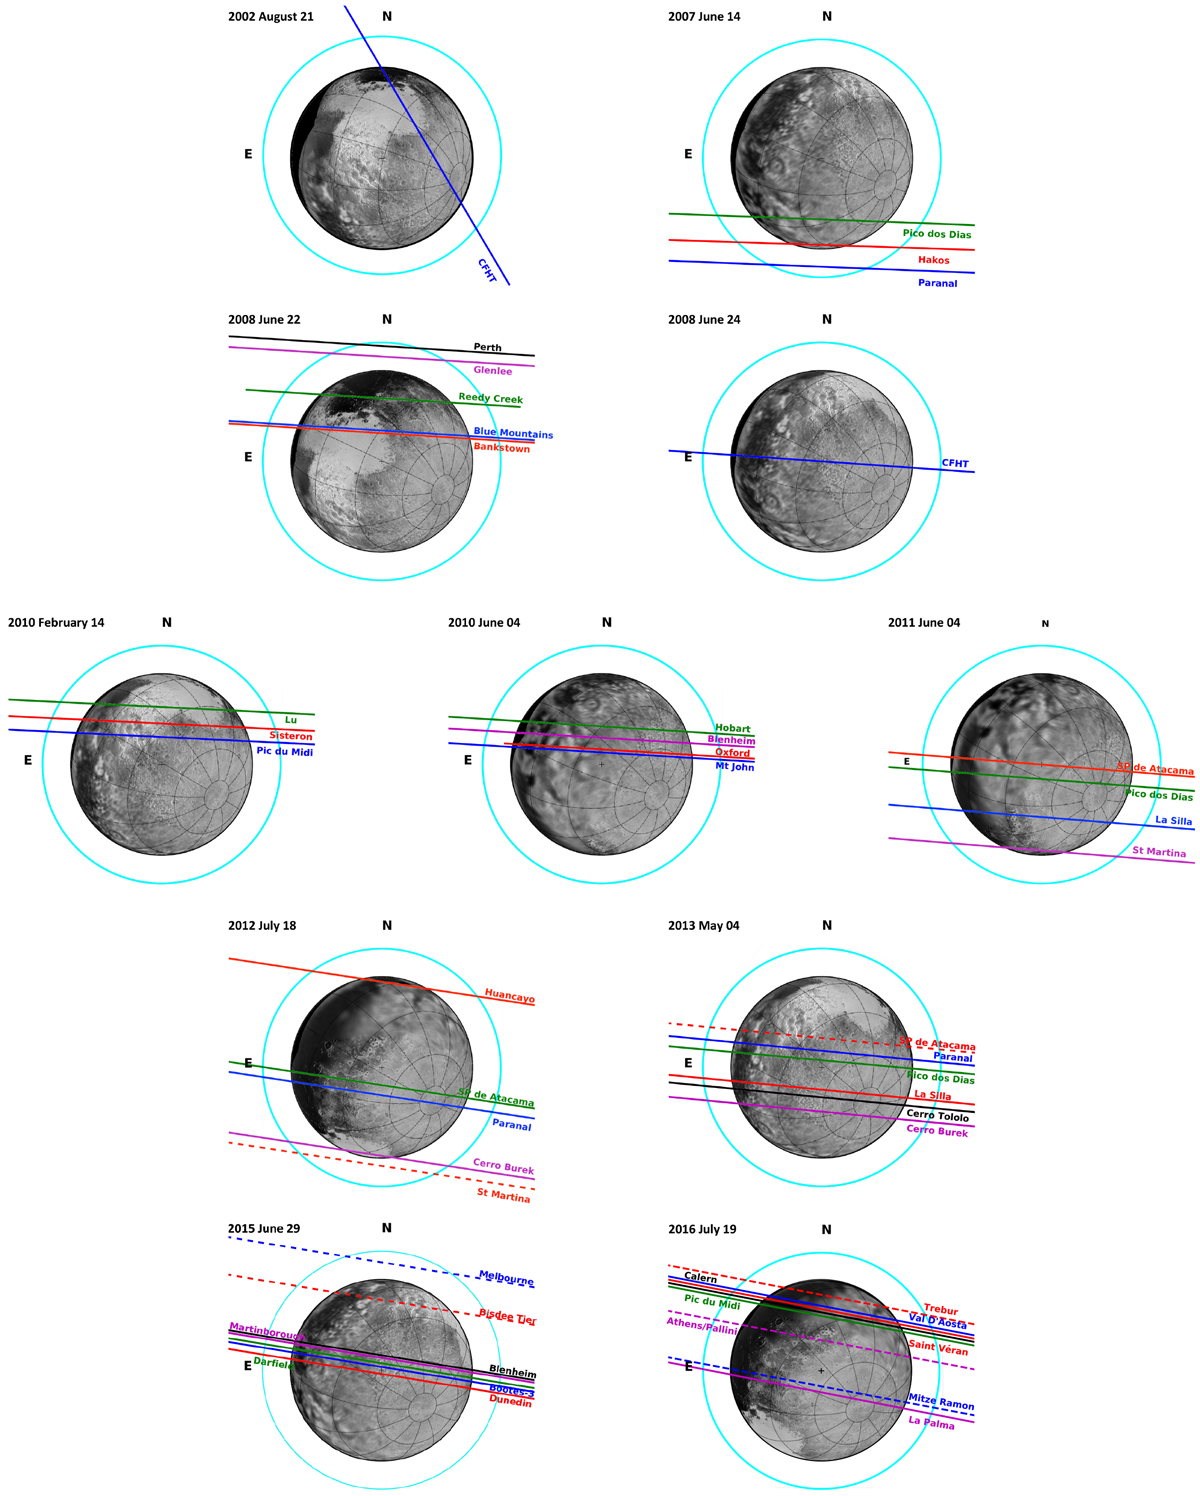
The occultation geometries reconstructed from the fits shown in Figs. 2 and 3. Labels N and E show the J2000 celestial north and east directions, respectively. The cyan circle corresponds to the 1% stellar drop, the practical detection limit for the best data sets. The purpose of the dashed lines is to distinguish between lines with the same color, and have no other meaning. In the background, a Pluto map taken by NH during its flyby.
Current usage metrics show cumulative count of Article Views (full-text article views including HTML views, PDF and ePub downloads, according to the available data) and Abstracts Views on Vision4Press platform.
Data correspond to usage on the plateform after 2015. The current usage metrics is available 48-96 hours after online publication and is updated daily on week days.
Initial download of the metrics may take a while.