Fig. 10

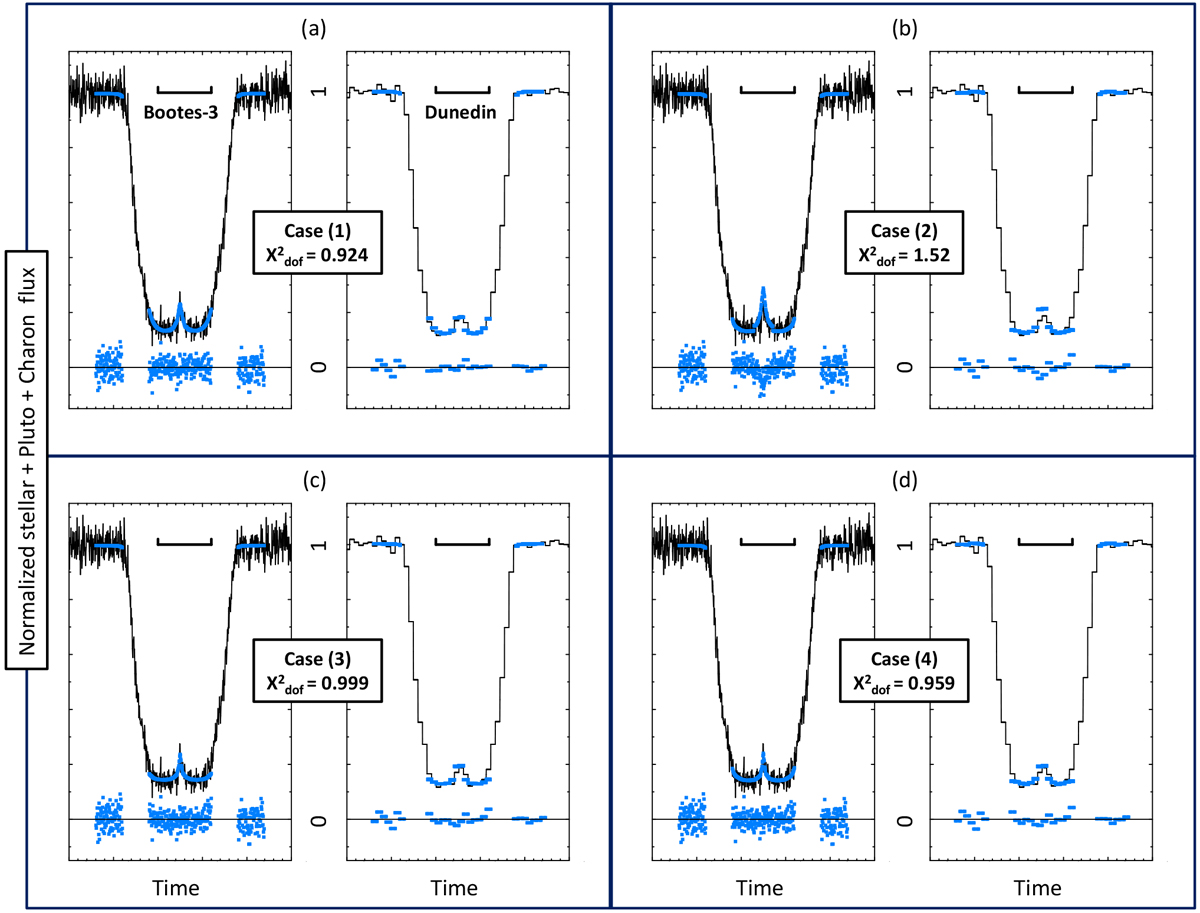
In each panel, the synthetic fits to the Bootes-3 (left) and Dunedin (right) observations of 2015 June 29 shown as blue points, together with the residuals (observations minus model) under each light curve, for each of the cases discussed in the text. The tick marks on the time axis are plotted every 10 s, and the horizontal bars above each curve show the one-minute interval from 16h 52 m30 to 16h 53 m30s UT. (a) Best fits to the Bootes-3 and Dunedin light curves using the DO15 light curve fitting model (Sicardy et al. 2016); see also Figs. 7 and 8. (b) As in panels a but using the nominal REX density profile. We note that the synthetic flashes are too high at both stations. (c) As in (a) and (b) but after multiplying the REX density profiles by a factor f = 0.805 and moving the shadow of Pluto 17 km north of the solution of Sicardy et al. (2016). (d) As in panels c using the nominal REX profiles, but with a topographic feature of height h = 1.35 km that blocks the stellar image during part of its motion along the southern Pluto limb (Fig. 5); the shadow has now been moved by 19.5 km north of the solution of Sicardy et al. (2016). In each panel, the value of the χ2 function per degree of freedom (![]() ) provides an estimation of the quality of the fit; see text for discussion.
) provides an estimation of the quality of the fit; see text for discussion.
Current usage metrics show cumulative count of Article Views (full-text article views including HTML views, PDF and ePub downloads, according to the available data) and Abstracts Views on Vision4Press platform.
Data correspond to usage on the plateform after 2015. The current usage metrics is available 48-96 hours after online publication and is updated daily on week days.
Initial download of the metrics may take a while.


