Fig. 4
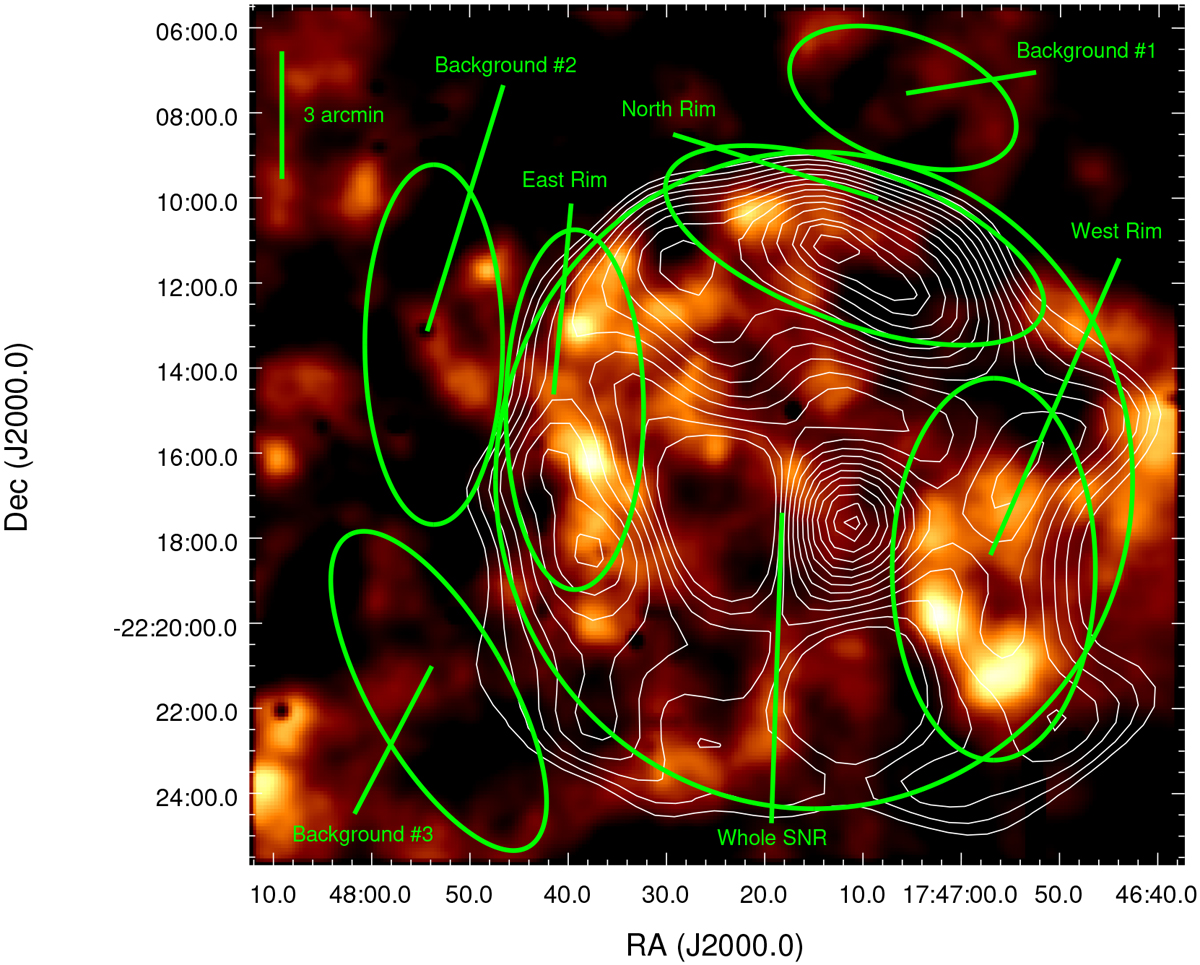
Same as Fig. 3 but with contours overlaid that depict radio emission detected by the MWA and regions of spectral extraction indicated and labeled. The contour levels correspond to 0.03, 0.04, 0.05, 0.06, 0.07, 0.08, 0.09, 0.10, 0.11, 0.12, 0.13, 0.14, 0.15, 0.155, and 0.16 Jy beam−1. The X-ray emission along the eastern and western rims of G5.9+3.1 appears to lie interior to the radio rims, while X-ray and radio emission from the northern and southern rims are weak or absent. The source regions of spectral extraction for the northern, western, and eastern rims along with the entire SNR are indicated, as well as the accompanying regions of background spectral extraction.
Current usage metrics show cumulative count of Article Views (full-text article views including HTML views, PDF and ePub downloads, according to the available data) and Abstracts Views on Vision4Press platform.
Data correspond to usage on the plateform after 2015. The current usage metrics is available 48-96 hours after online publication and is updated daily on week days.
Initial download of the metrics may take a while.