Fig. 1
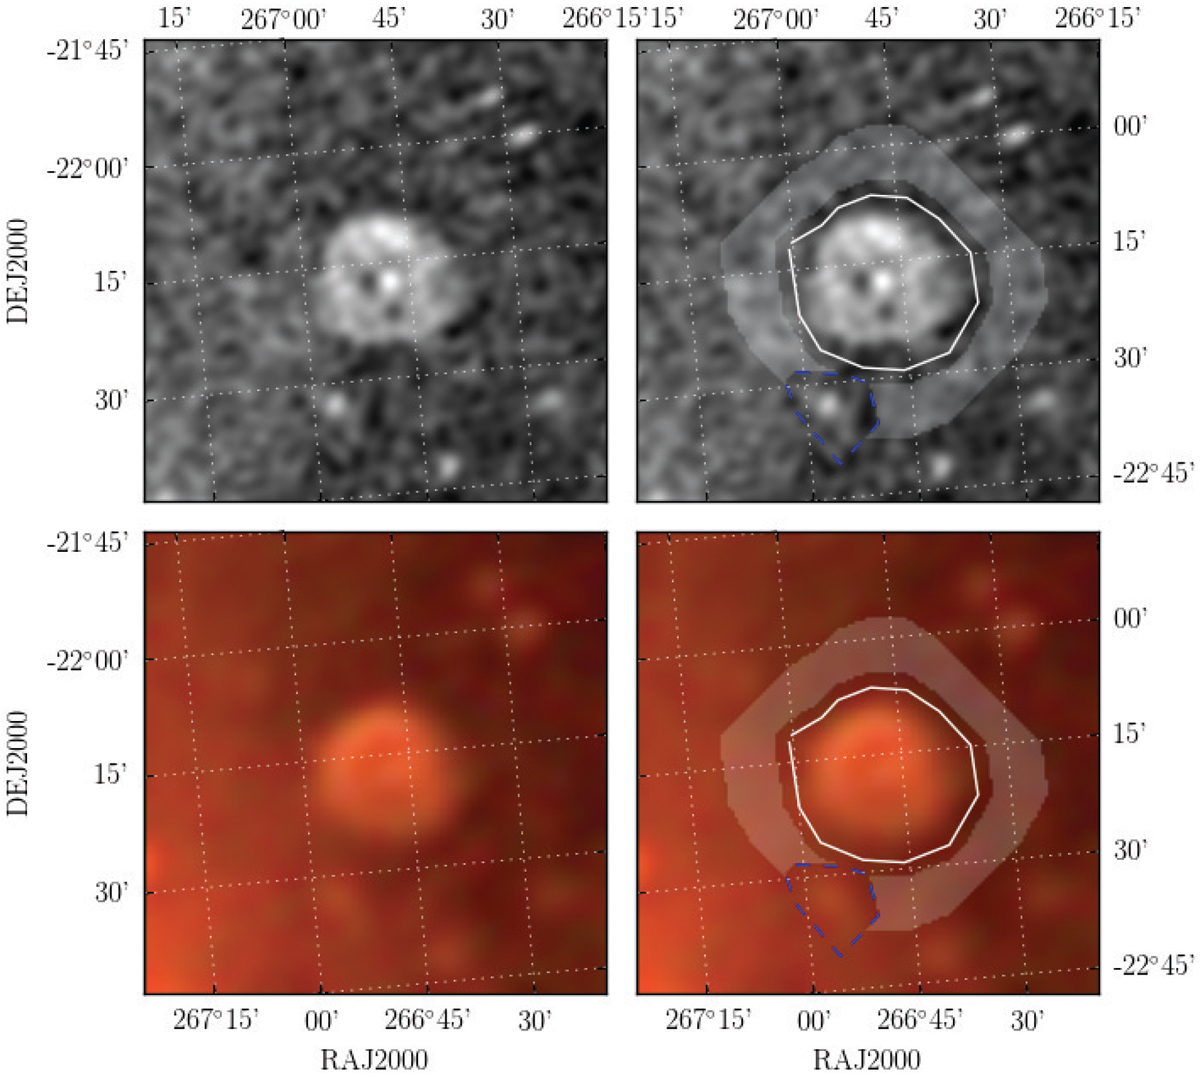
GLEAM images of G5.9+3.1. Top two panels: wideband image taken over 170–231 MHz. Lower two panels: an RGB image comprised of R = 72–103 MHz, G = 103–134 MHz, B = 139–170 MHz. The full width at half maximums (FWHMs) of the point spread functions (PSFs) of the images are, respectively: 2.4′, 5.2′, 3.9′, and 2.9′. Left panels: images without any annotations. Right panels: annotations indicating the GLEAM photometry measurement; the white lines show the region drawn by the observer that contains the SNR; the gray shaded region shows the area used to calculate the background; the blue dashed lines show a region excluded from the background measurement for containing contaminating background radio galaxies.
Current usage metrics show cumulative count of Article Views (full-text article views including HTML views, PDF and ePub downloads, according to the available data) and Abstracts Views on Vision4Press platform.
Data correspond to usage on the plateform after 2015. The current usage metrics is available 48-96 hours after online publication and is updated daily on week days.
Initial download of the metrics may take a while.