Fig. 3.
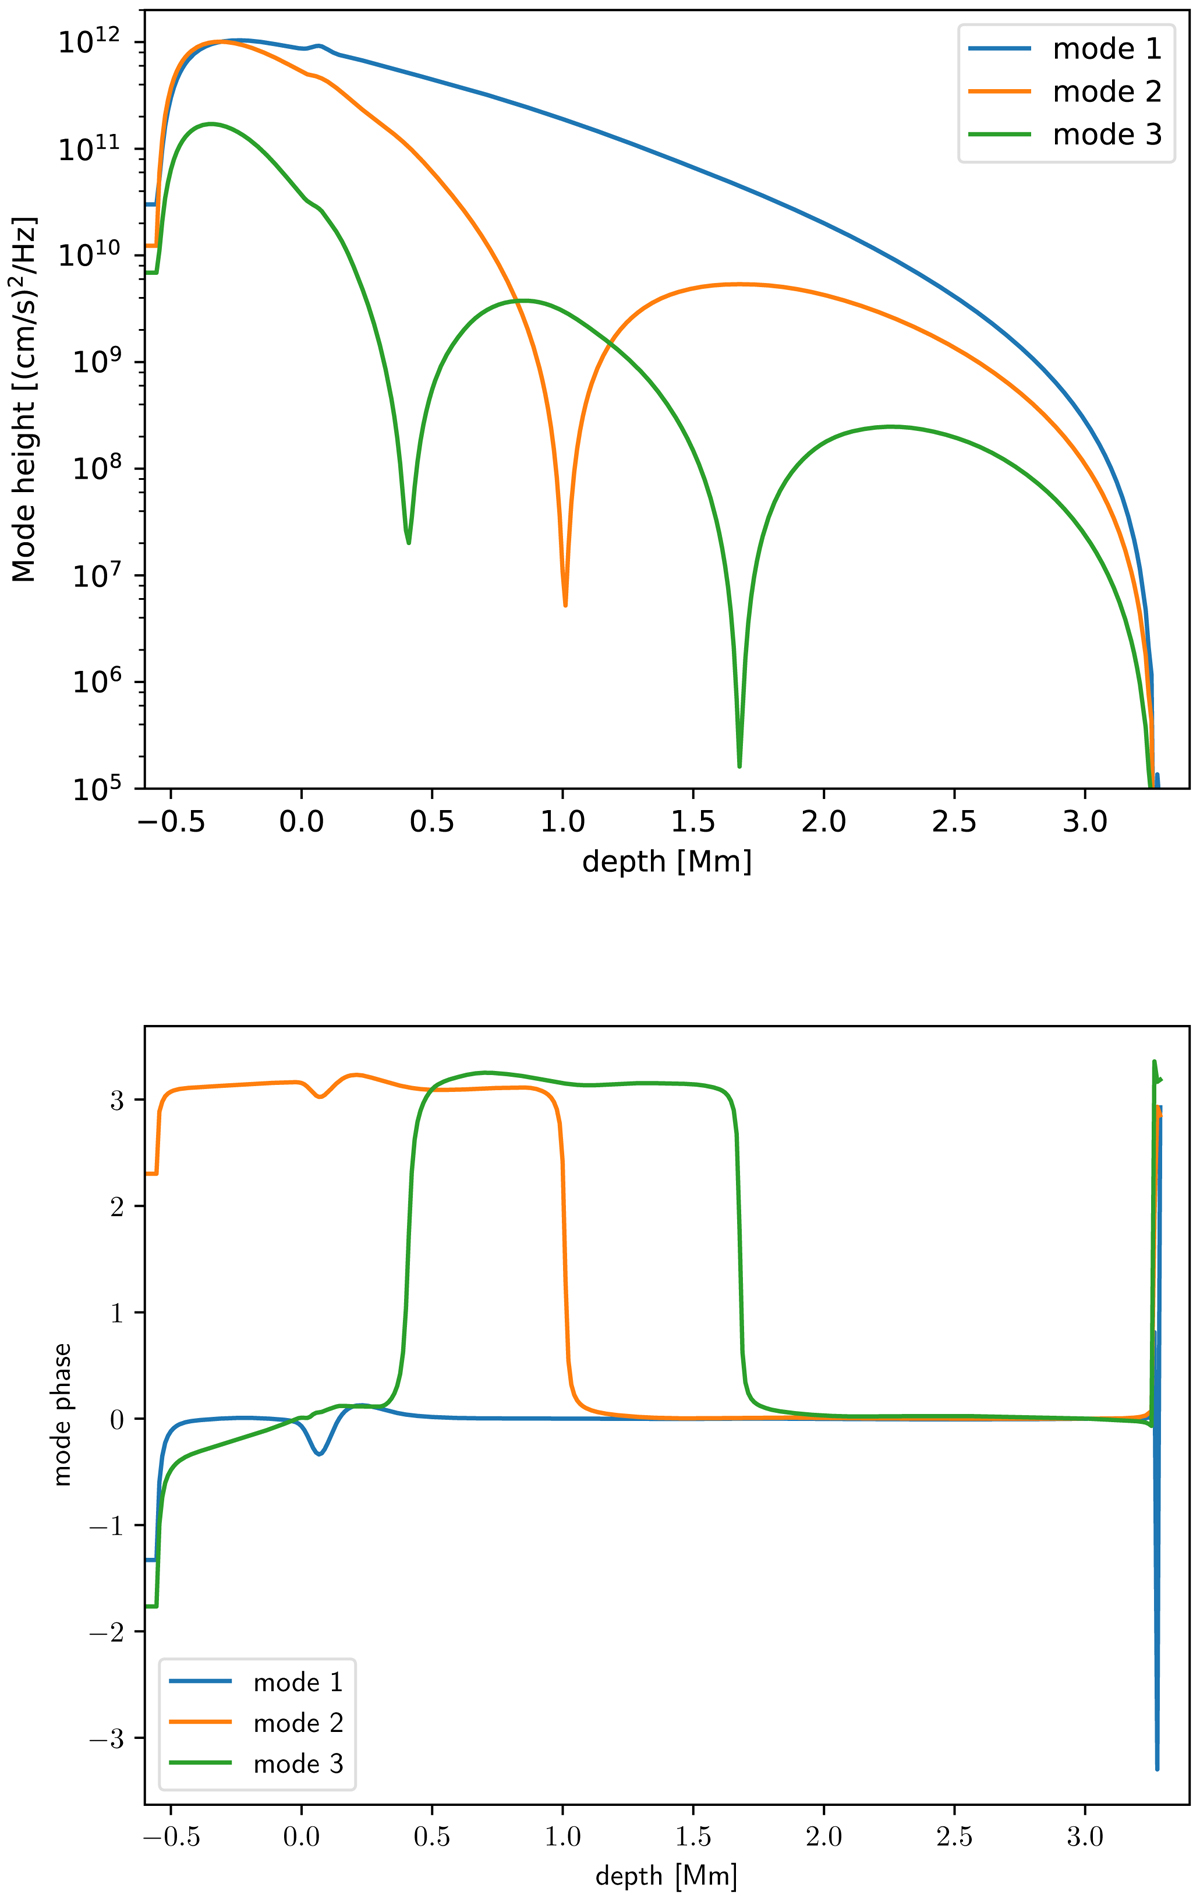
Top panel: mode velocity power density as a function of the depth for the three modes identified in Table 1. As for Fig. 1, the zero-point depth is chosen where the temporally and horizontally averaged temperature equals the effective temperature. Bottom panel: same as for top panel except that the mode phases, computed directly in the Fourier space, are displayed. The zero-point phases are chosen at a depth equal to 3 Mm.
Current usage metrics show cumulative count of Article Views (full-text article views including HTML views, PDF and ePub downloads, according to the available data) and Abstracts Views on Vision4Press platform.
Data correspond to usage on the plateform after 2015. The current usage metrics is available 48-96 hours after online publication and is updated daily on week days.
Initial download of the metrics may take a while.