Open Access
Fig. 7.
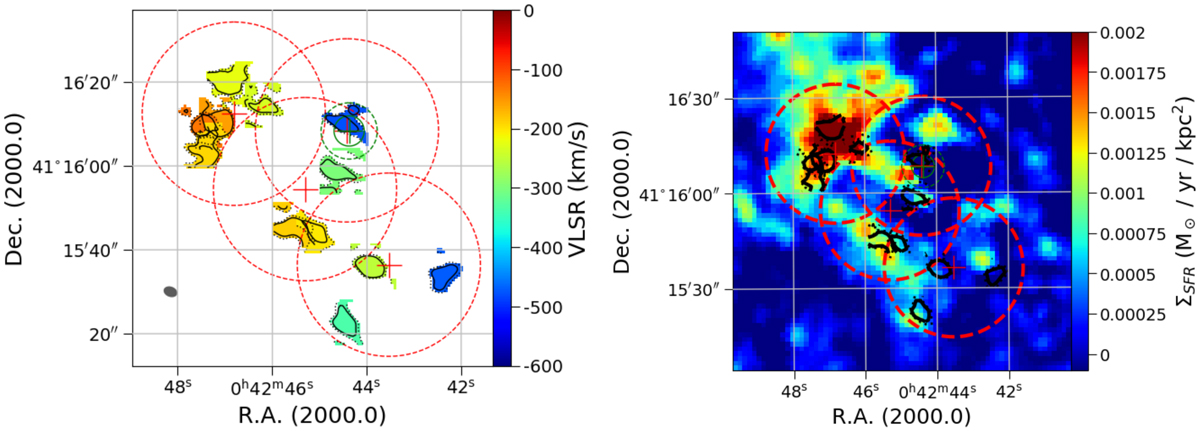
Left: mean velocity map of the selected clumps with 1σ(dotted) and 2σ (solid) intensity contours around clump. Right: map of the surface density SFR in M 31 central region from Ford et al. (2013) with the contours of our clumps superposed.
Current usage metrics show cumulative count of Article Views (full-text article views including HTML views, PDF and ePub downloads, according to the available data) and Abstracts Views on Vision4Press platform.
Data correspond to usage on the plateform after 2015. The current usage metrics is available 48-96 hours after online publication and is updated daily on week days.
Initial download of the metrics may take a while.